Meeting Planner Satisfaction Survey & Key Measures Dashboard: Post-Event Survey Workbook with 20 Measures, Ranking and Action Plan
Full description
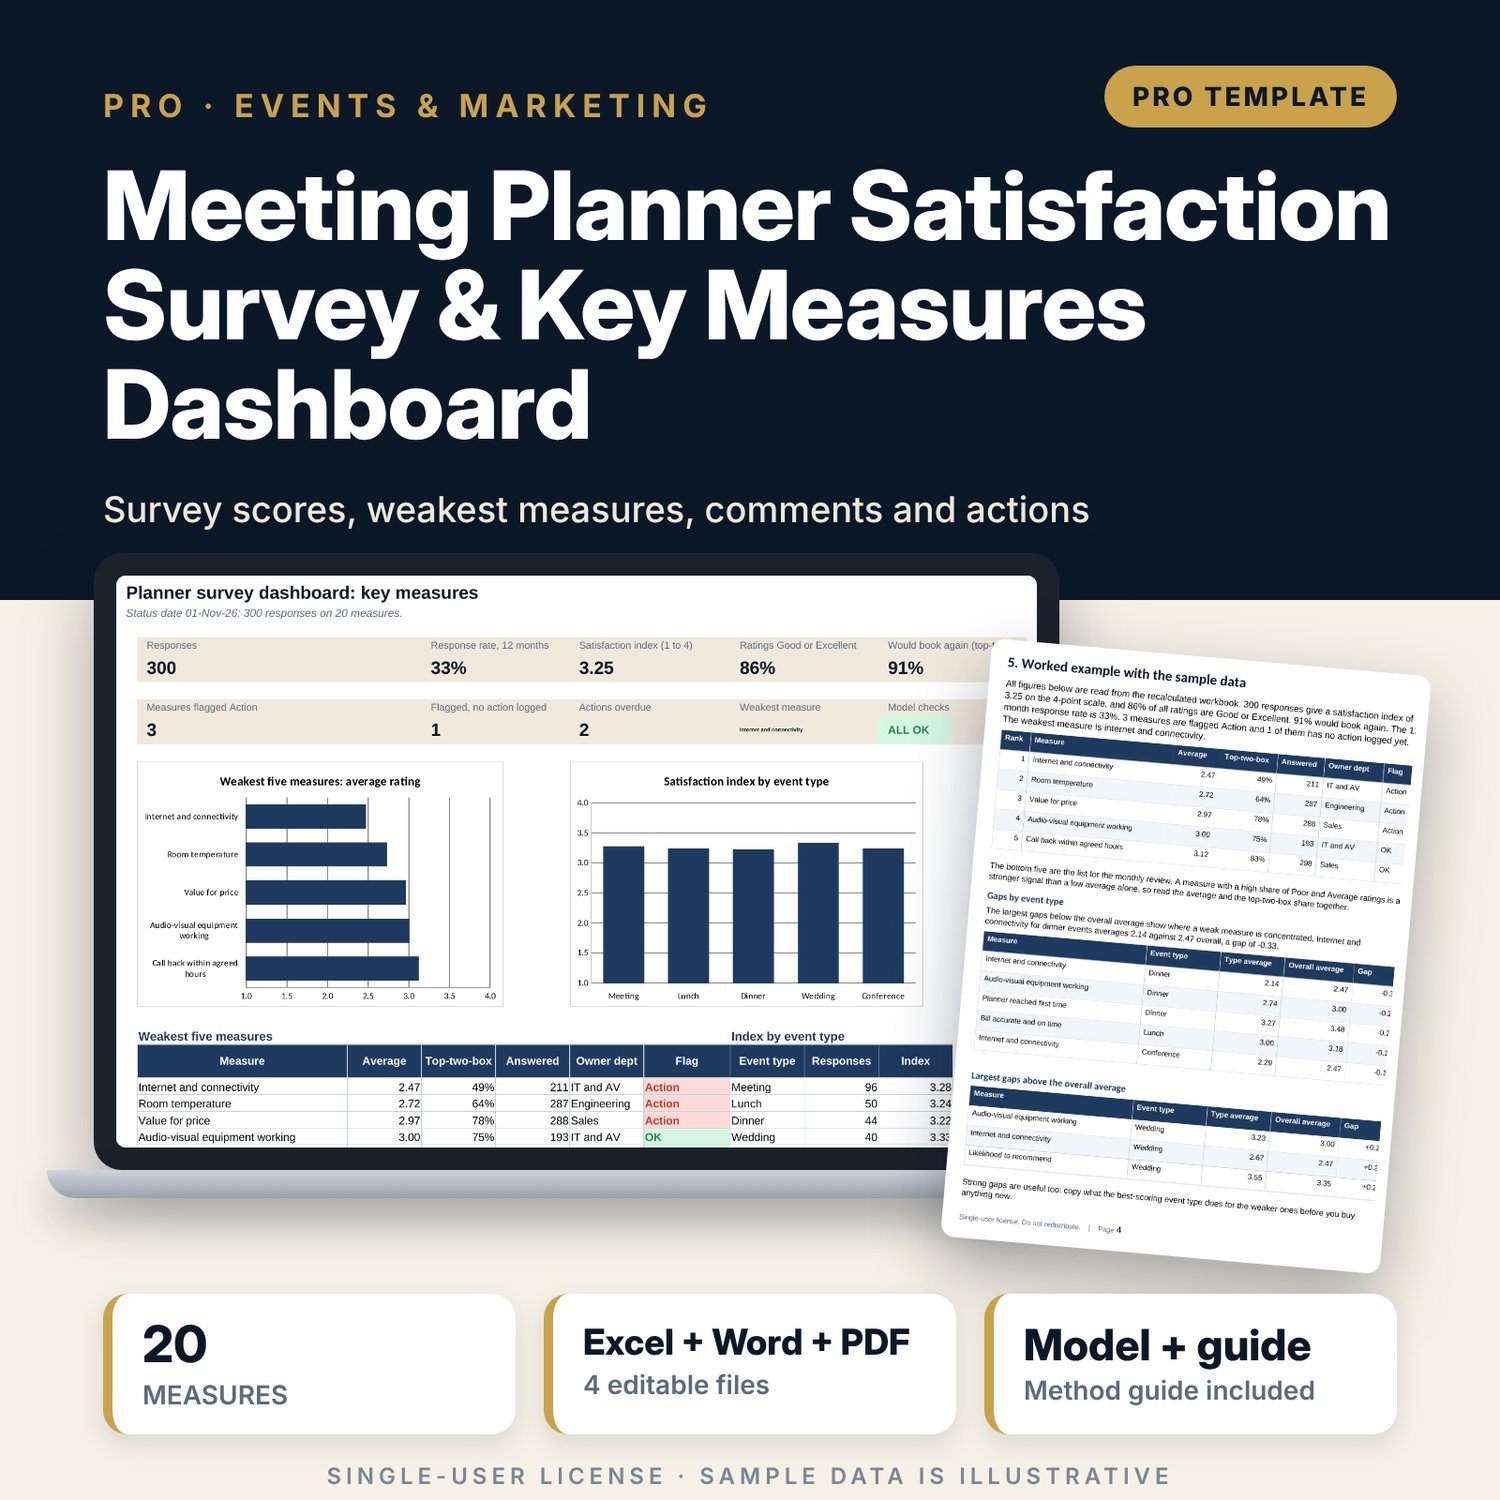
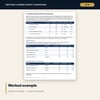
For sales managers, event coordinators and hotel or venue managers who want to know what meeting planners really think. The workbook scores 20 measures from 300 sample responses, ranks the weakest, shows the gap for each event type, codes verbatim comments by theme and tone, tracks the response rate and keeps an action plan with owners and due dates. A companion workbook gives you a printable one-page survey form, an entry sheet that turns ticked labels into scores, and a follow-up tracker for the 24-hour send and the 5-day reminder. The 8-page guide explains the method with a worked example.
What is inside
- Planner_Survey_Dashboard.xlsx: 12 tabs, 2,021 formulas, 6 native charts, 18 drop-down and input rules
- Measures and Responses: 20 measures with owner department and weight; 300 sample responses plus 40 spare rows, each with a weighted index, comment, theme and tone
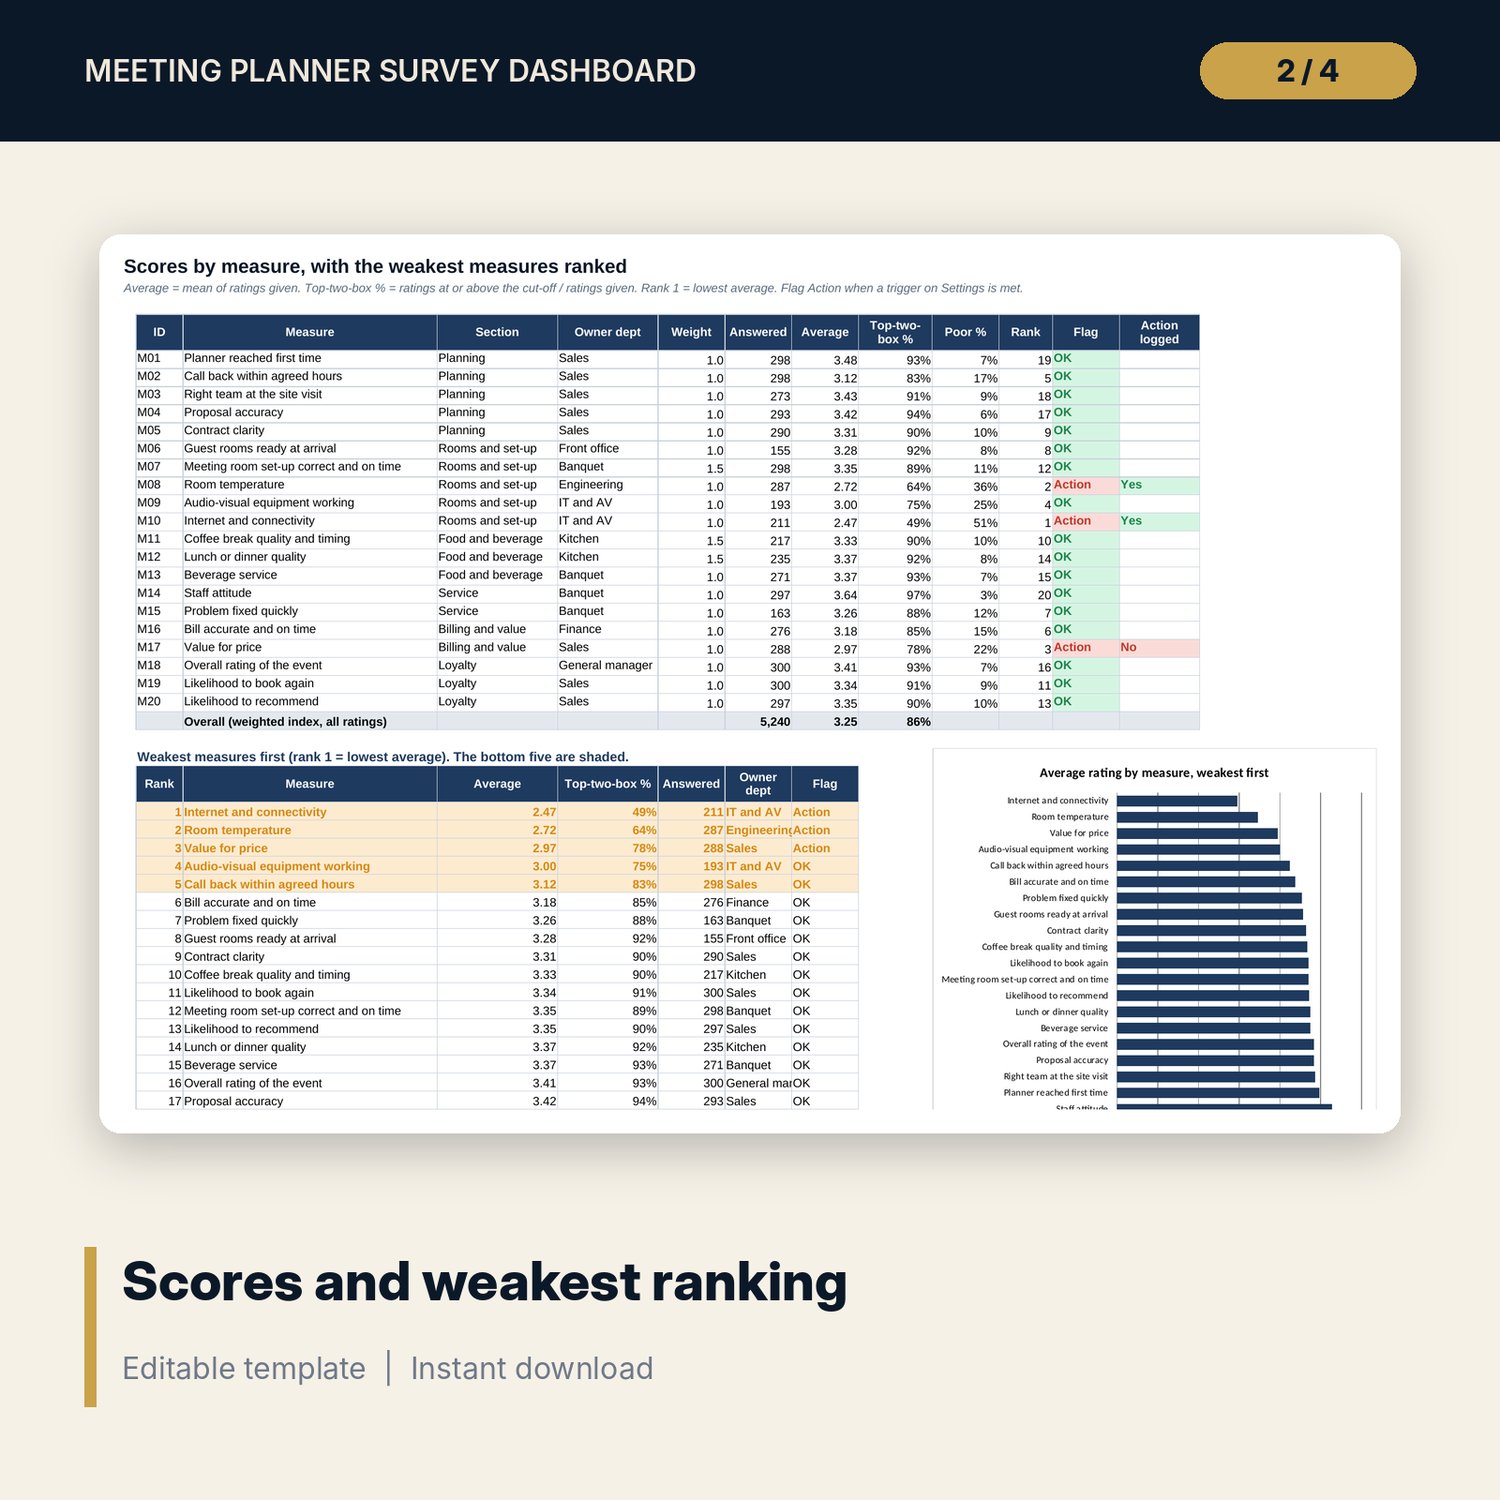
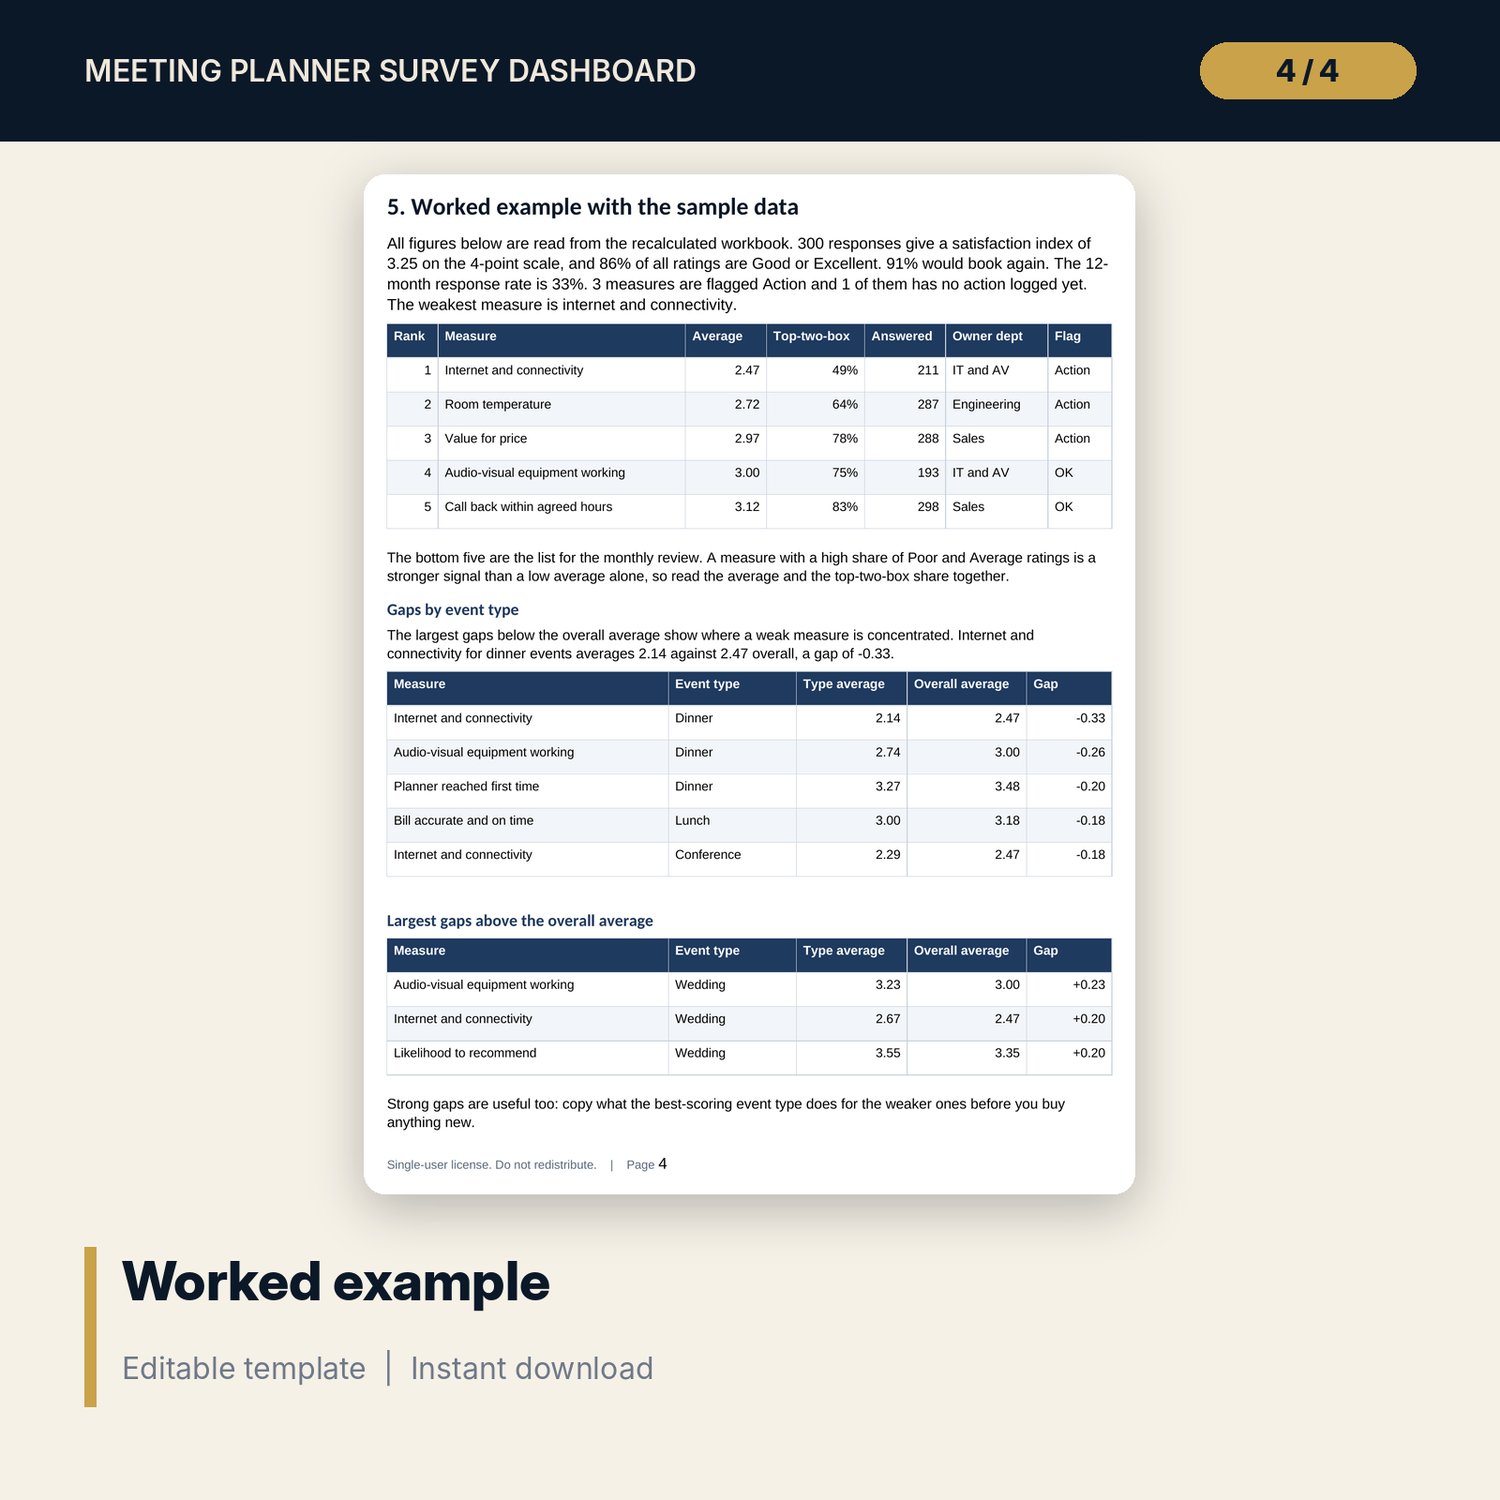
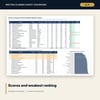
- Scores: average, top-two-box %, poor %, rank and flag for every measure, with a weakest-first ranking table and chart
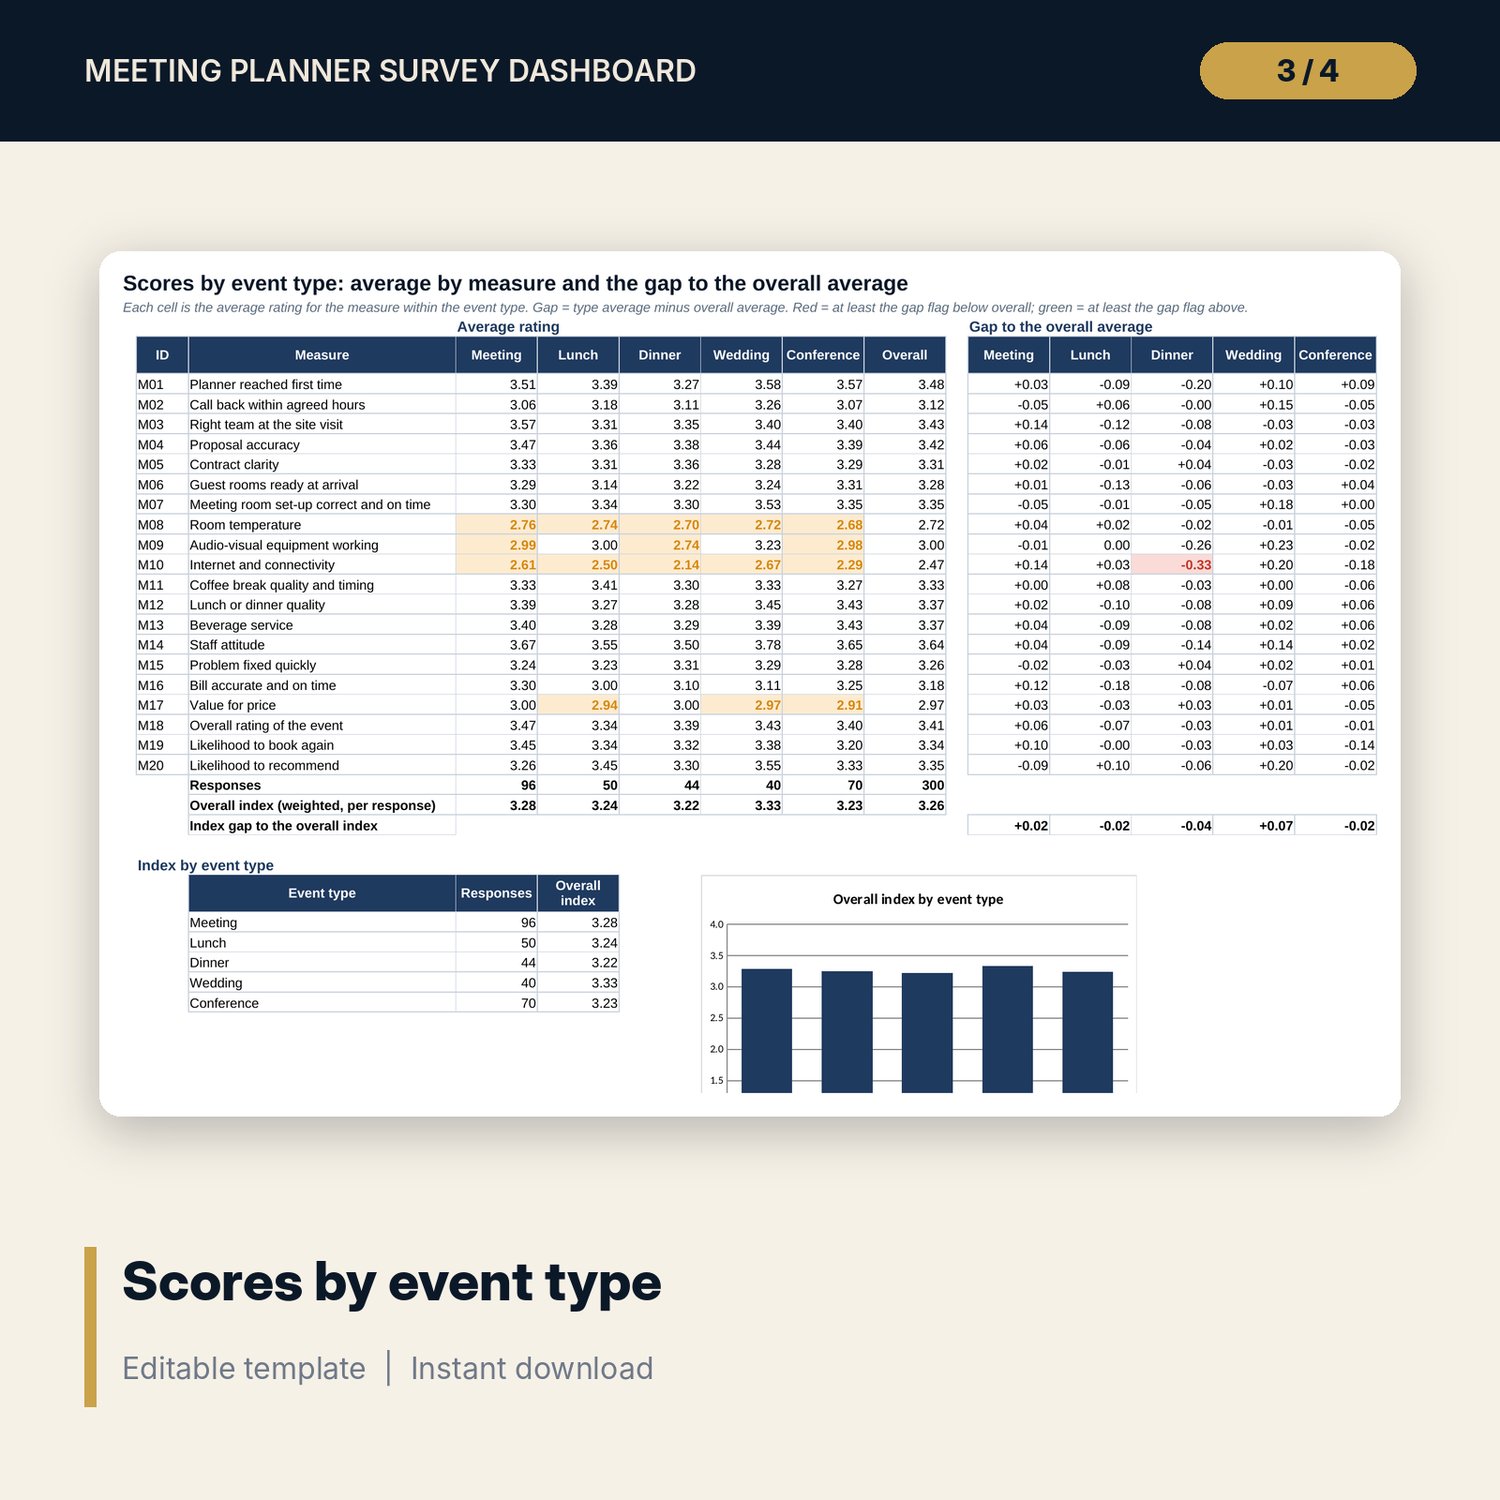
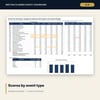
- By Event Type: average by measure for five event types and the gap to the overall average, with highlights
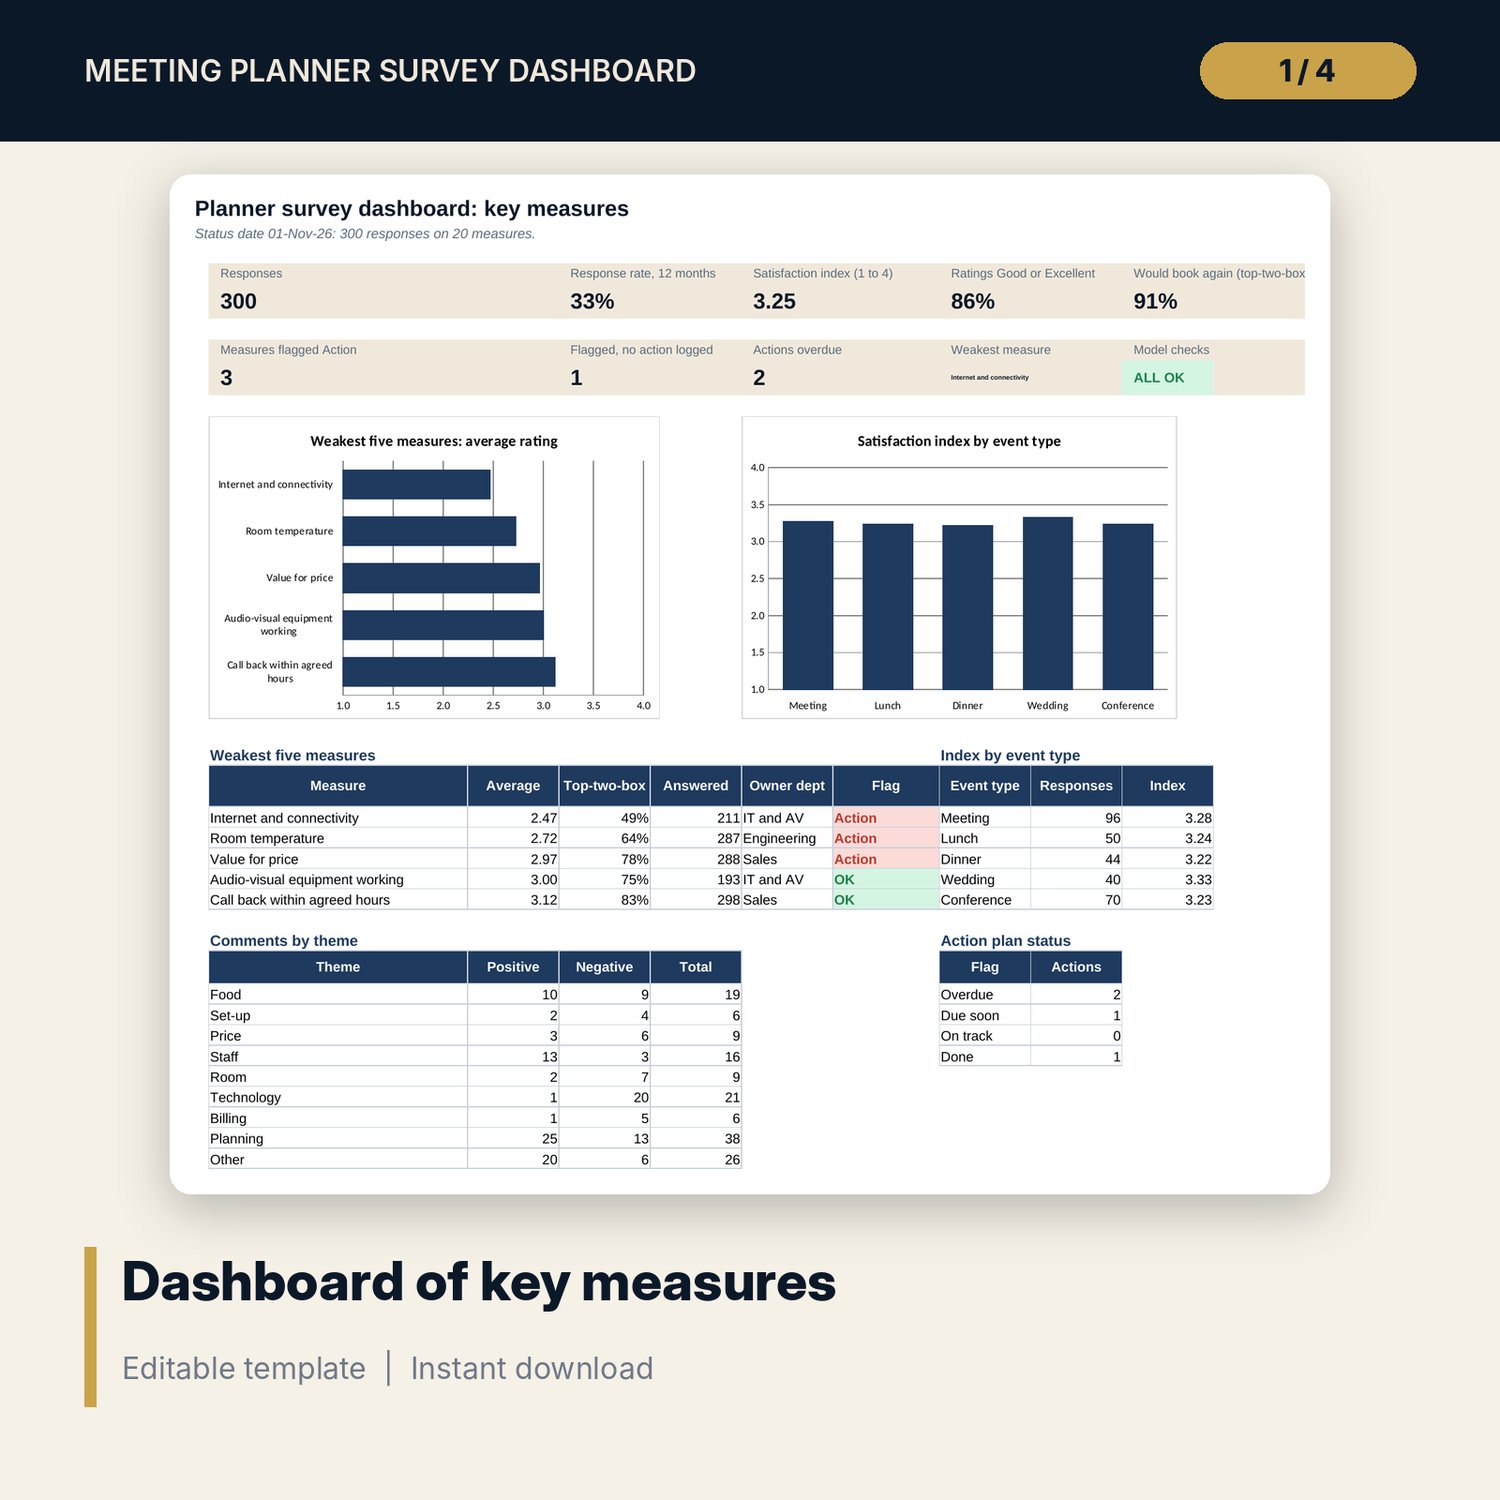
- Verbatim Themes, Response Rate and Action Plan: nine themes by tone, response rate by month and by event type, and an action list with flags
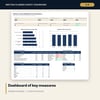
- Dashboard: 10 tiles (one is the check status), weakest five measures, index by event type and two charts; 12 integrity checks, a Method tab
- Planner_Survey_Form_and_Entry.xlsx: 5 tabs, 756 formulas: survey form, entry sheet for 24 forms, follow-up tracker and a batch summary with five checks
- Planner_Survey_Guide.docx and PDF: 8 pages with the method, worked example, coding guide, action record and review agenda
- README.txt and LICENSE-and-Terms.txt
How it works
- Set the status date and your own triggers on Settings.
- Print the survey form and send it within 24 hours of each event; track replies on Follow-up.
- Enter returned forms on Entry and copy the scores into Responses; code each comment.
- Read Scores, By Event Type and the Dashboard; log an action for every flagged measure.
- Review monthly with the guide agenda and recheck next quarter.
Details
- Formats: 2 Excel workbooks (.xlsx), 1 guide in Word (.docx) and PDF, English
- Software: Excel 2016 or later, or LibreOffice Calc 7 or later
- No macros, no external links, no data tables, no array formulas
- 4 files plus README and license; instant digital download
Good to know
- Sample data is illustrative. Replace it with your own figures.
- Triggers, weights and the response-rate range are your own policy. Fewer than 30 answers show Low n instead of a flag.
- The files are management tools, not statistical or legal advice.
- Single-user license. Do not redistribute.
FAQ
What does top-two-box % mean?
The share of ratings that are Good or Excellent (3 or 4 on the 4-point scale), out of the ratings given.
Which measures are flagged for action?
Any measure with an average below 3.0 or a top-two-box share below 70%. Both triggers are editable on Settings.
Can I change the questions?
Yes. Edit the wording and weights on the Measures tab. The workbook is built for 20 measures; keep to 20 or leave unused ones blank-weighted.
How are comments coded?
Each comment gets one of nine themes and a tone. Counts, share negative and the department responsible update automatically.
Do I need macros?
No. Every result is a standard worksheet formula.