Climate Risk & Resilience Assessment for Hotels: Hazard Scoring, Adaptation Plan and Report Template
Full description
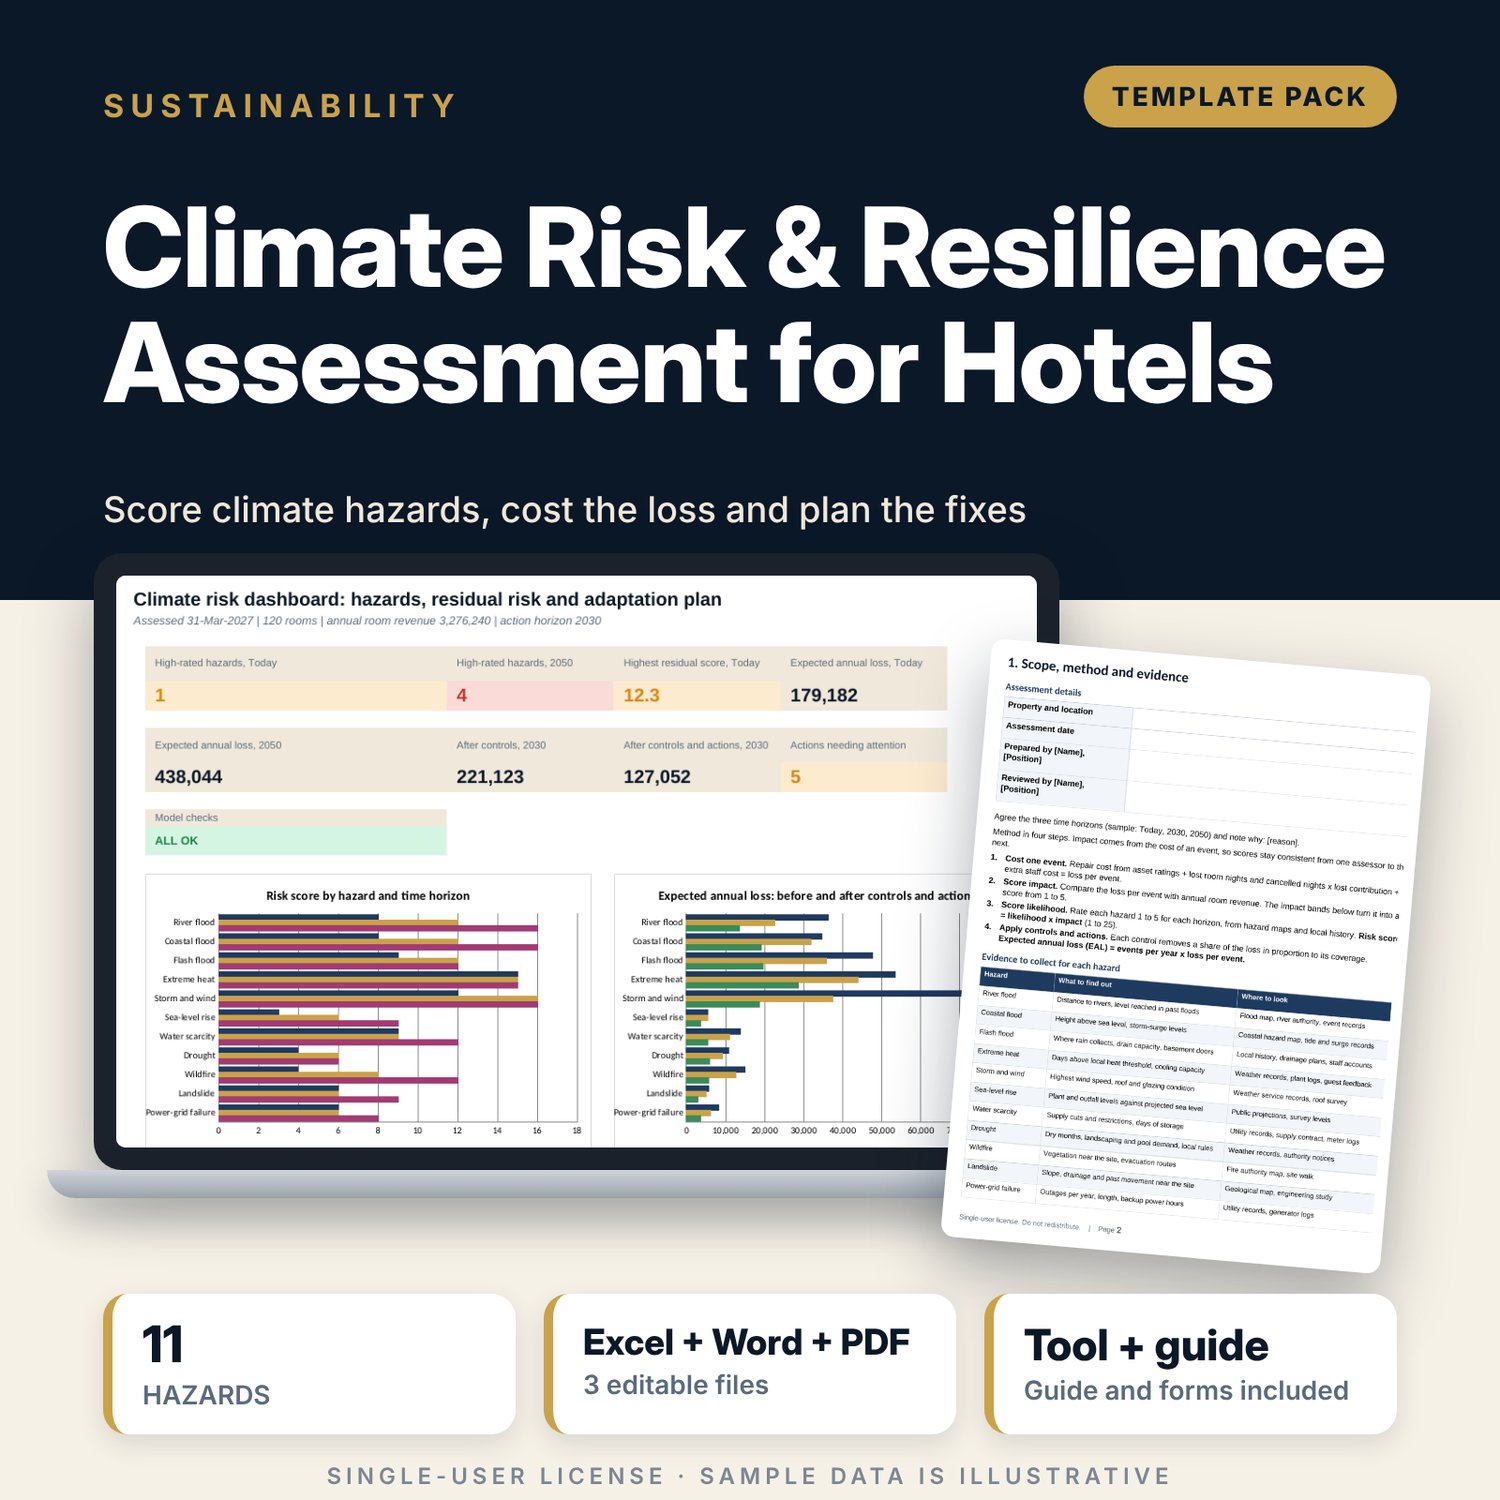
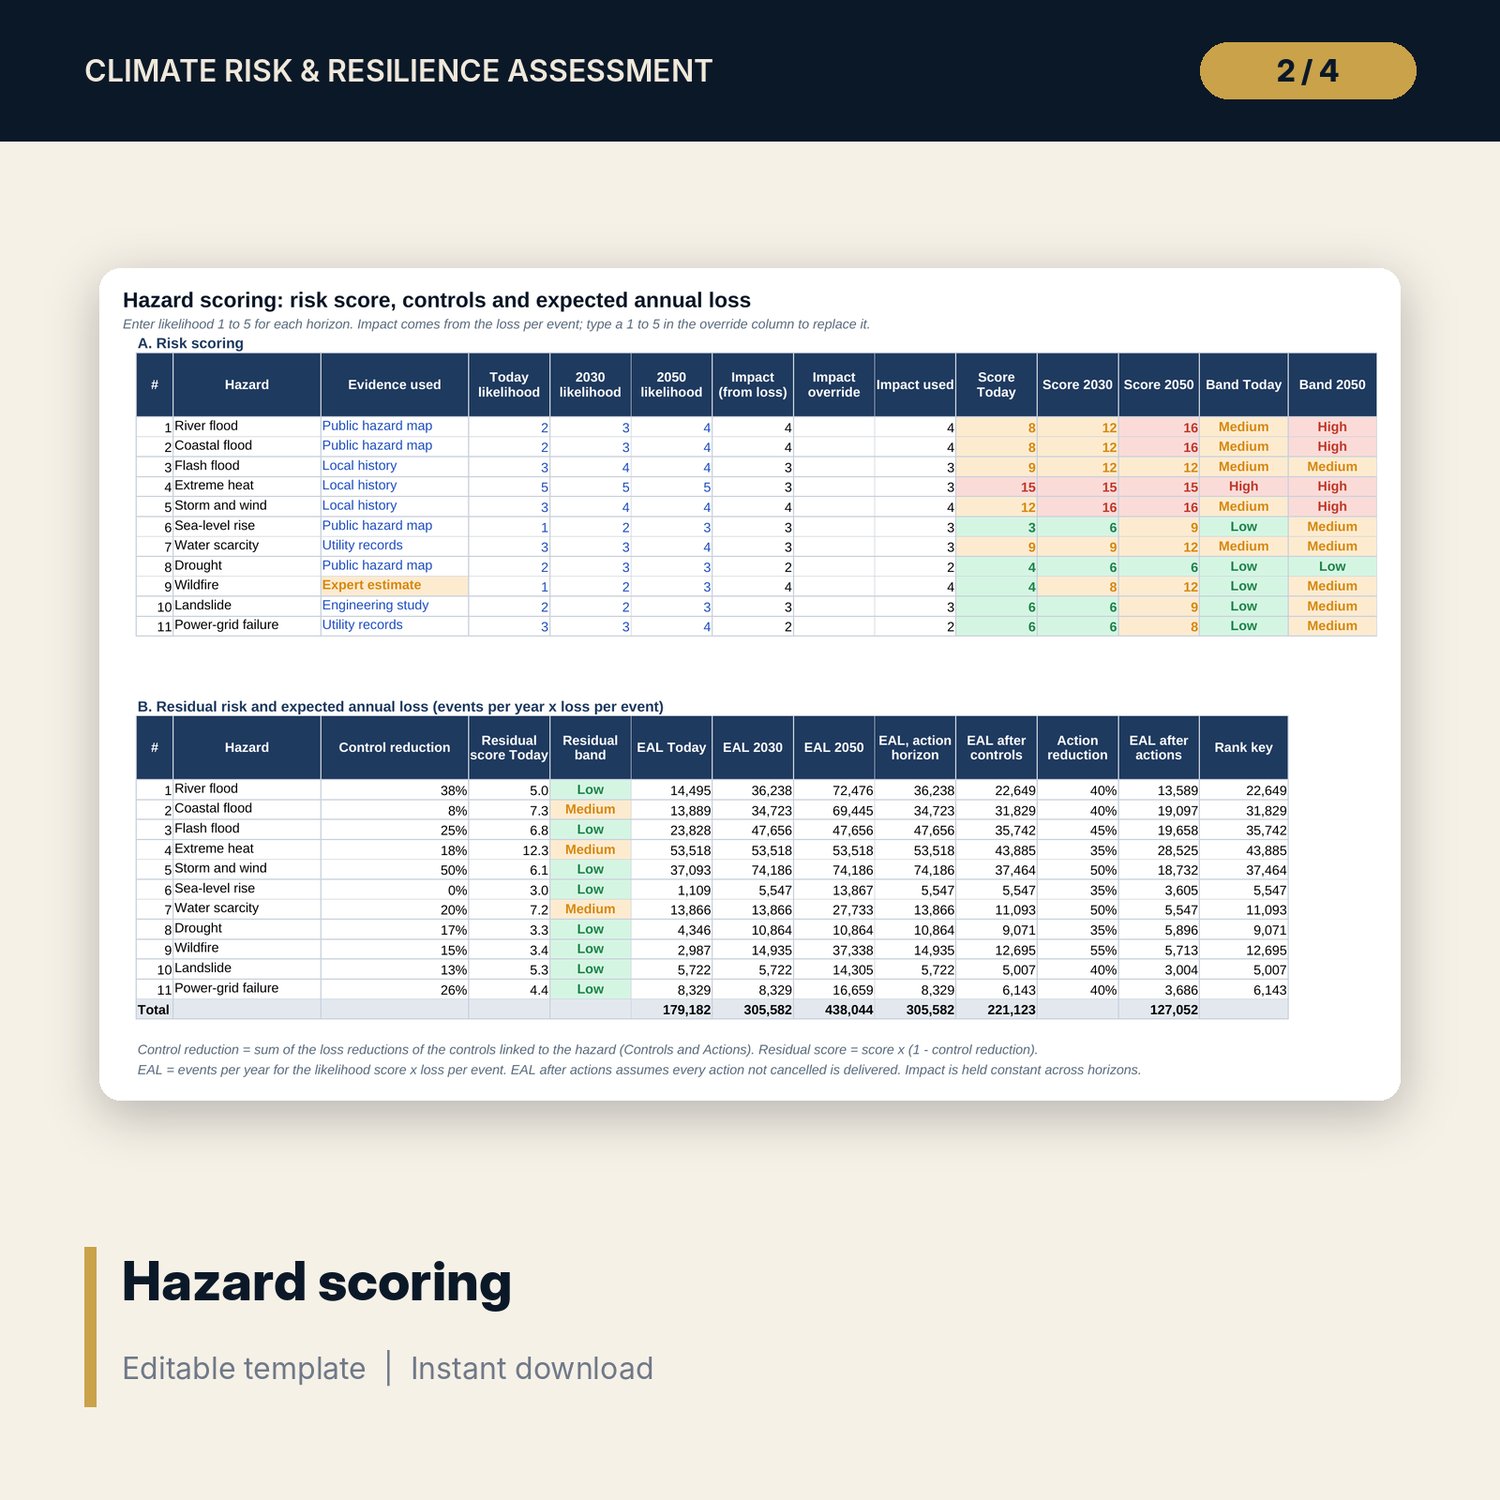
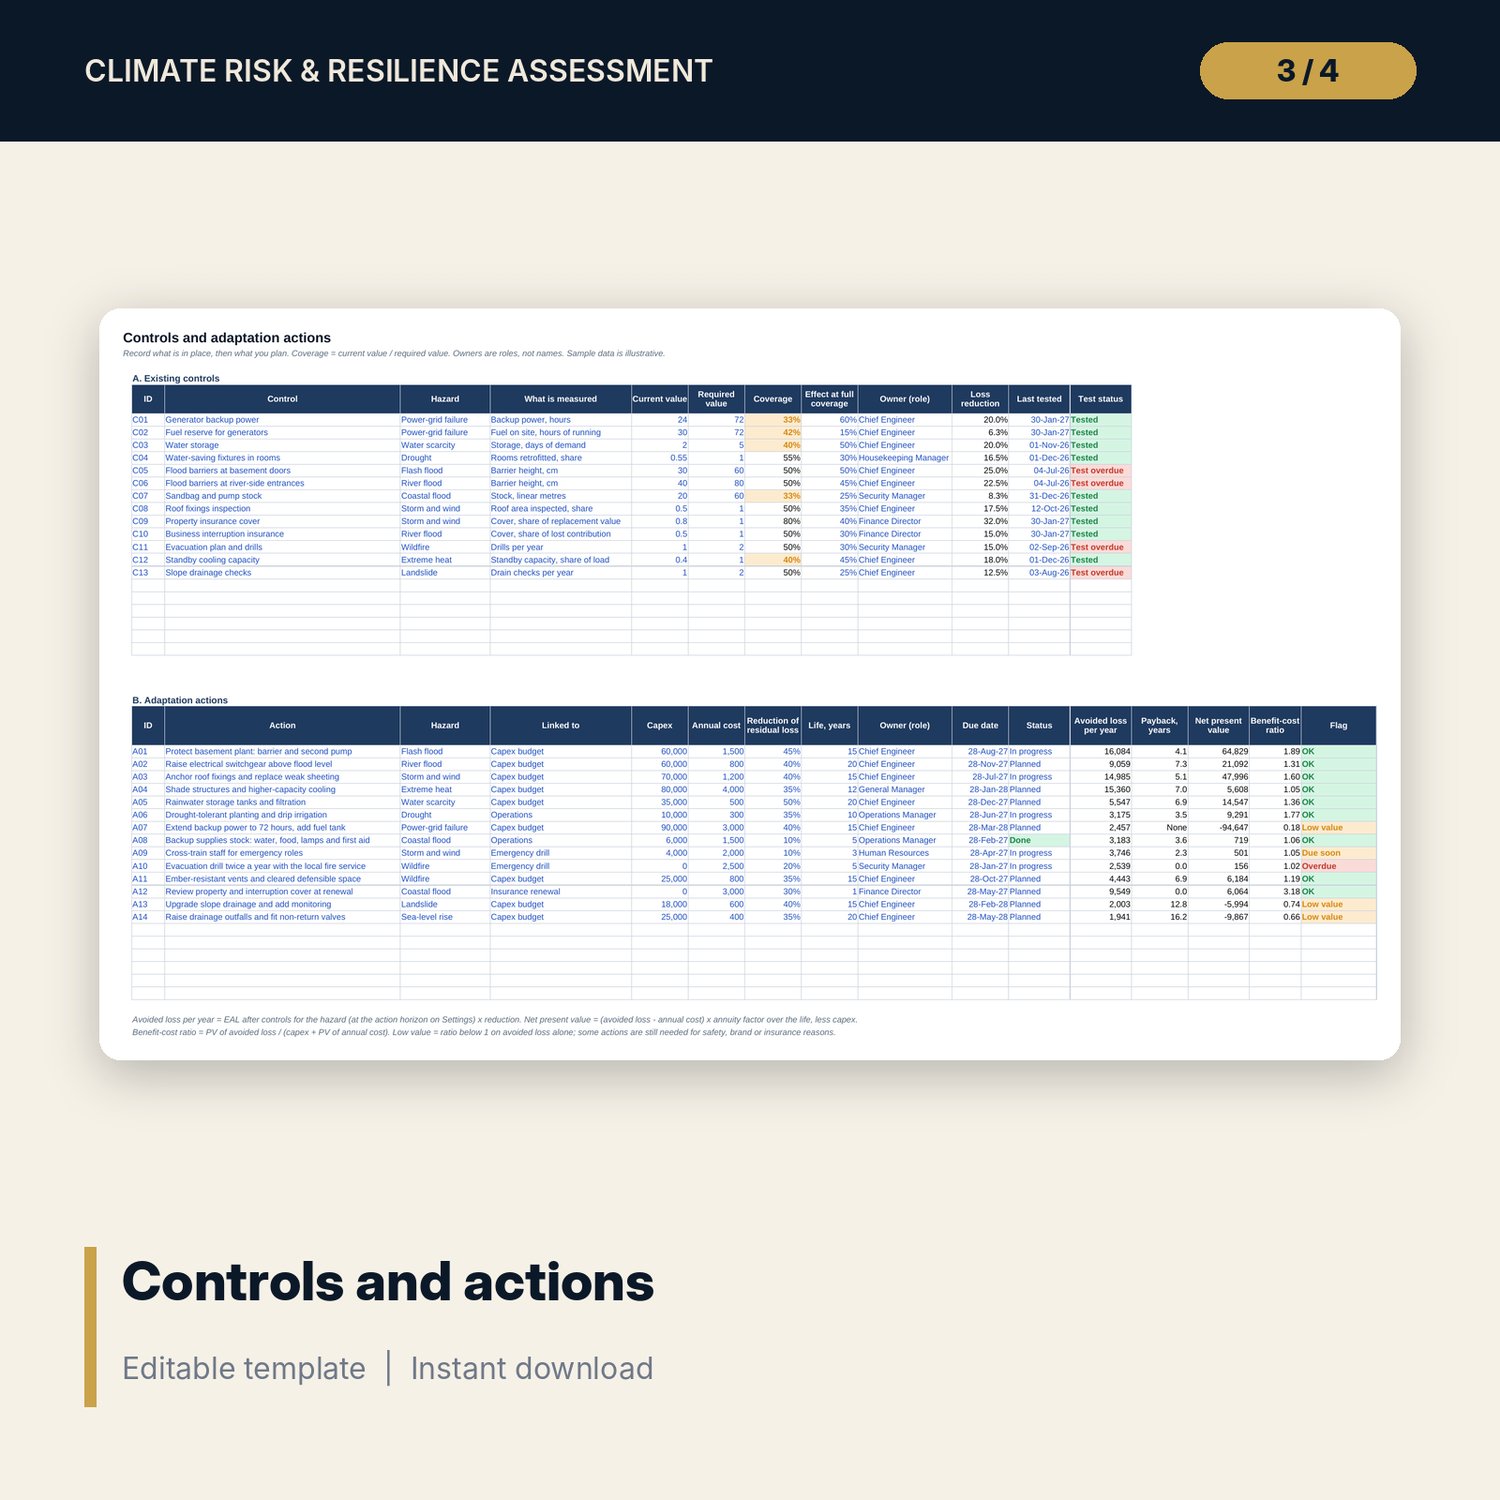
For general managers, chief engineers and sustainability leads who need a clear view of climate risk before an insurance renewal, an emergency drill or a capex round. The workbook scores 11 hazards (river, coastal and flash flood, extreme heat, storm, sea-level rise, water scarcity, drought, wildfire, landslide and power-grid failure) for today, 2030 and 2050. Likelihood times impact gives a risk score with editable bands. Impact is not guessed: it comes from the cost of one event, built from 10 assets rated against each hazard, lost room nights, cancelled nights and extra staff cost. Existing controls reduce the loss in proportion to their coverage, and 14 adaptation actions are tested on avoided loss, payback, net present value and benefit-cost ratio. The Word template gives the method, the report layout, a review calendar and an event review form.
What is inside
- Climate_Risk_Assessment.xlsx: 7 tabs, 724 formulas, 2 native charts, 23 drop-down and input rules
- Settings: property profile, likelihood scale, 5 impact bands, risk bands, 3 damage factors, 3 time horizons, hazard list
- Asset Exposure: 10 sample assets plus 3 spare rows, rated 0 to 3 against 11 hazards, with repair cost and loss per event
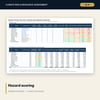
- Hazard Scoring: 11 hazards with likelihood for 3 horizons, risk score, band, residual score and expected annual loss before and after controls and actions
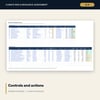
- Controls and Actions: 13 sample controls with coverage and test status, 14 sample actions with owner, due date, status, payback, net present value and ratio
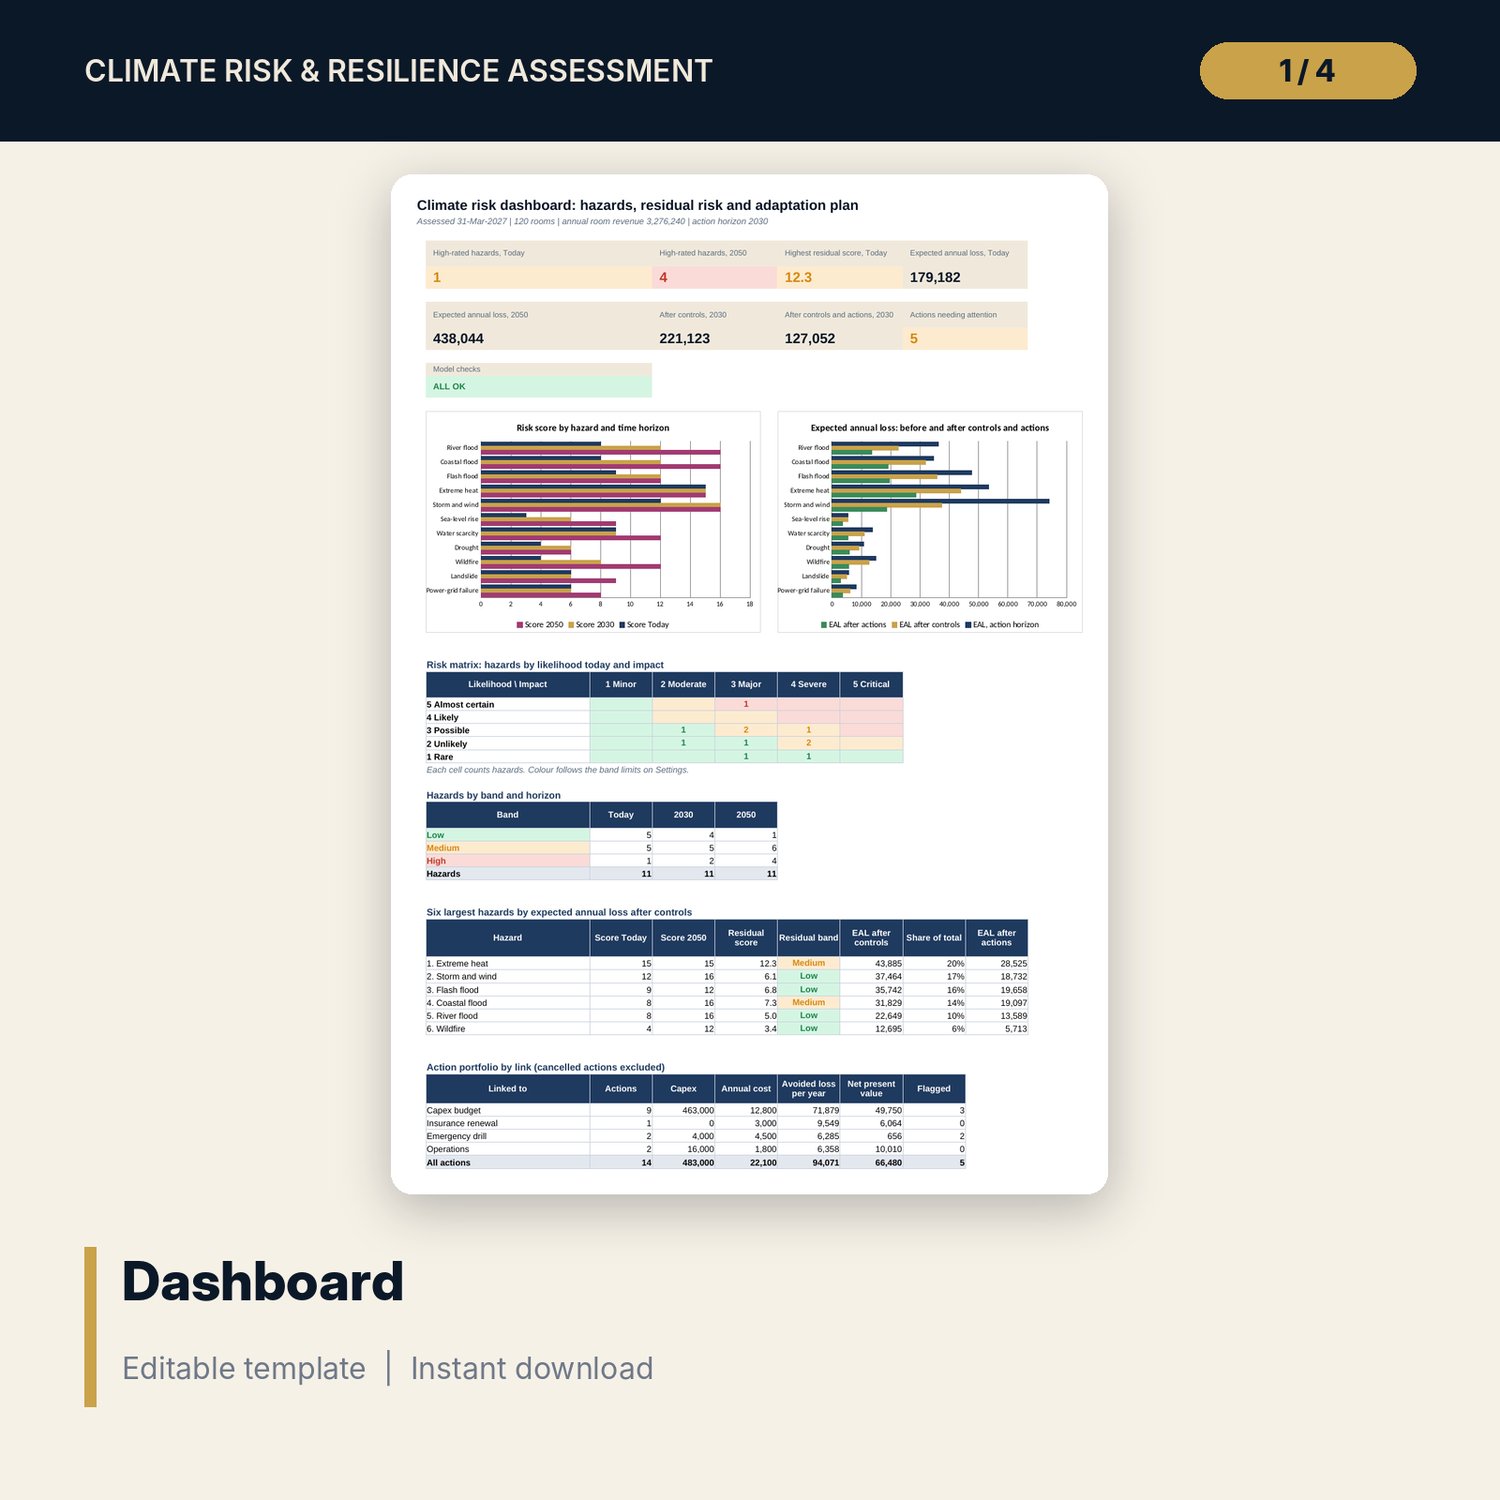
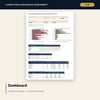
- Dashboard: 8 tiles, a check tile, a risk matrix, bands by horizon, top 6 hazards, action portfolio and 2 charts; 8 integrity checks on the Checks tab
- Climate_Risk_Assessment_Report.docx and PDF: 9 pages with method, scales, asset and impact tables, a worked example, controls, adaptation plan, review calendar, links to insurance, drills and capex, and event review form
- README.txt and LICENSE-and-Terms.txt
How it works
- Enter the property profile and review the scales and bands on Settings.
- List assets, rate exposure and enter the cost of one event for each hazard.
- Enter likelihood for each horizon, record controls and plan actions with owners and dates.
- Read the Dashboard, clear the flags and copy the results into the Word report.
Details
- Formats: 1 Excel workbook (.xlsx), 1 report template in Word (.docx) and PDF, English
- Software: Excel 2016 or later, or LibreOffice Calc 7 or later
- No macros, no external links, no data tables, no array formulas
- 3 files plus README and license; instant digital download
Good to know
- Sample data is illustrative. Replace it with your own figures.
- Ratings, likelihood, losses and costs are your inputs. Use public hazard maps and local history, and verify local requirements and insurance terms.
- This is a screening and planning tool. It does not replace an engineering survey, an insurer survey or advice from the authorities.
- Single-user license. Do not redistribute.
FAQ
How is the impact score set?
From the loss per event as a share of annual room revenue, using five bands you can edit. You can also type an override from 1 to 5 for any hazard.
How are the three time horizons used?
Likelihood is entered for each horizon. Impact is held constant, so the score and the expected annual loss rise only when likelihood rises.
What does a control do to the numbers?
Coverage is current value divided by required value. Loss reduction is coverage times the effect you assess. Reductions are added per hazard and capped.
How are adaptation actions ranked?
By avoided loss, payback, net present value and benefit-cost ratio. An action below a ratio of 1 is flagged Low value, so you can decide whether safety or insurance reasons justify it.
Can I add assets, controls and actions?
Yes. There are 3 spare asset rows, 6 spare control rows and 6 spare action rows.