
Unconstrained Demand & Turnaway Analyzer: Hotel Unconstrained Demand Calculator for Sold-Out Nights
Full description
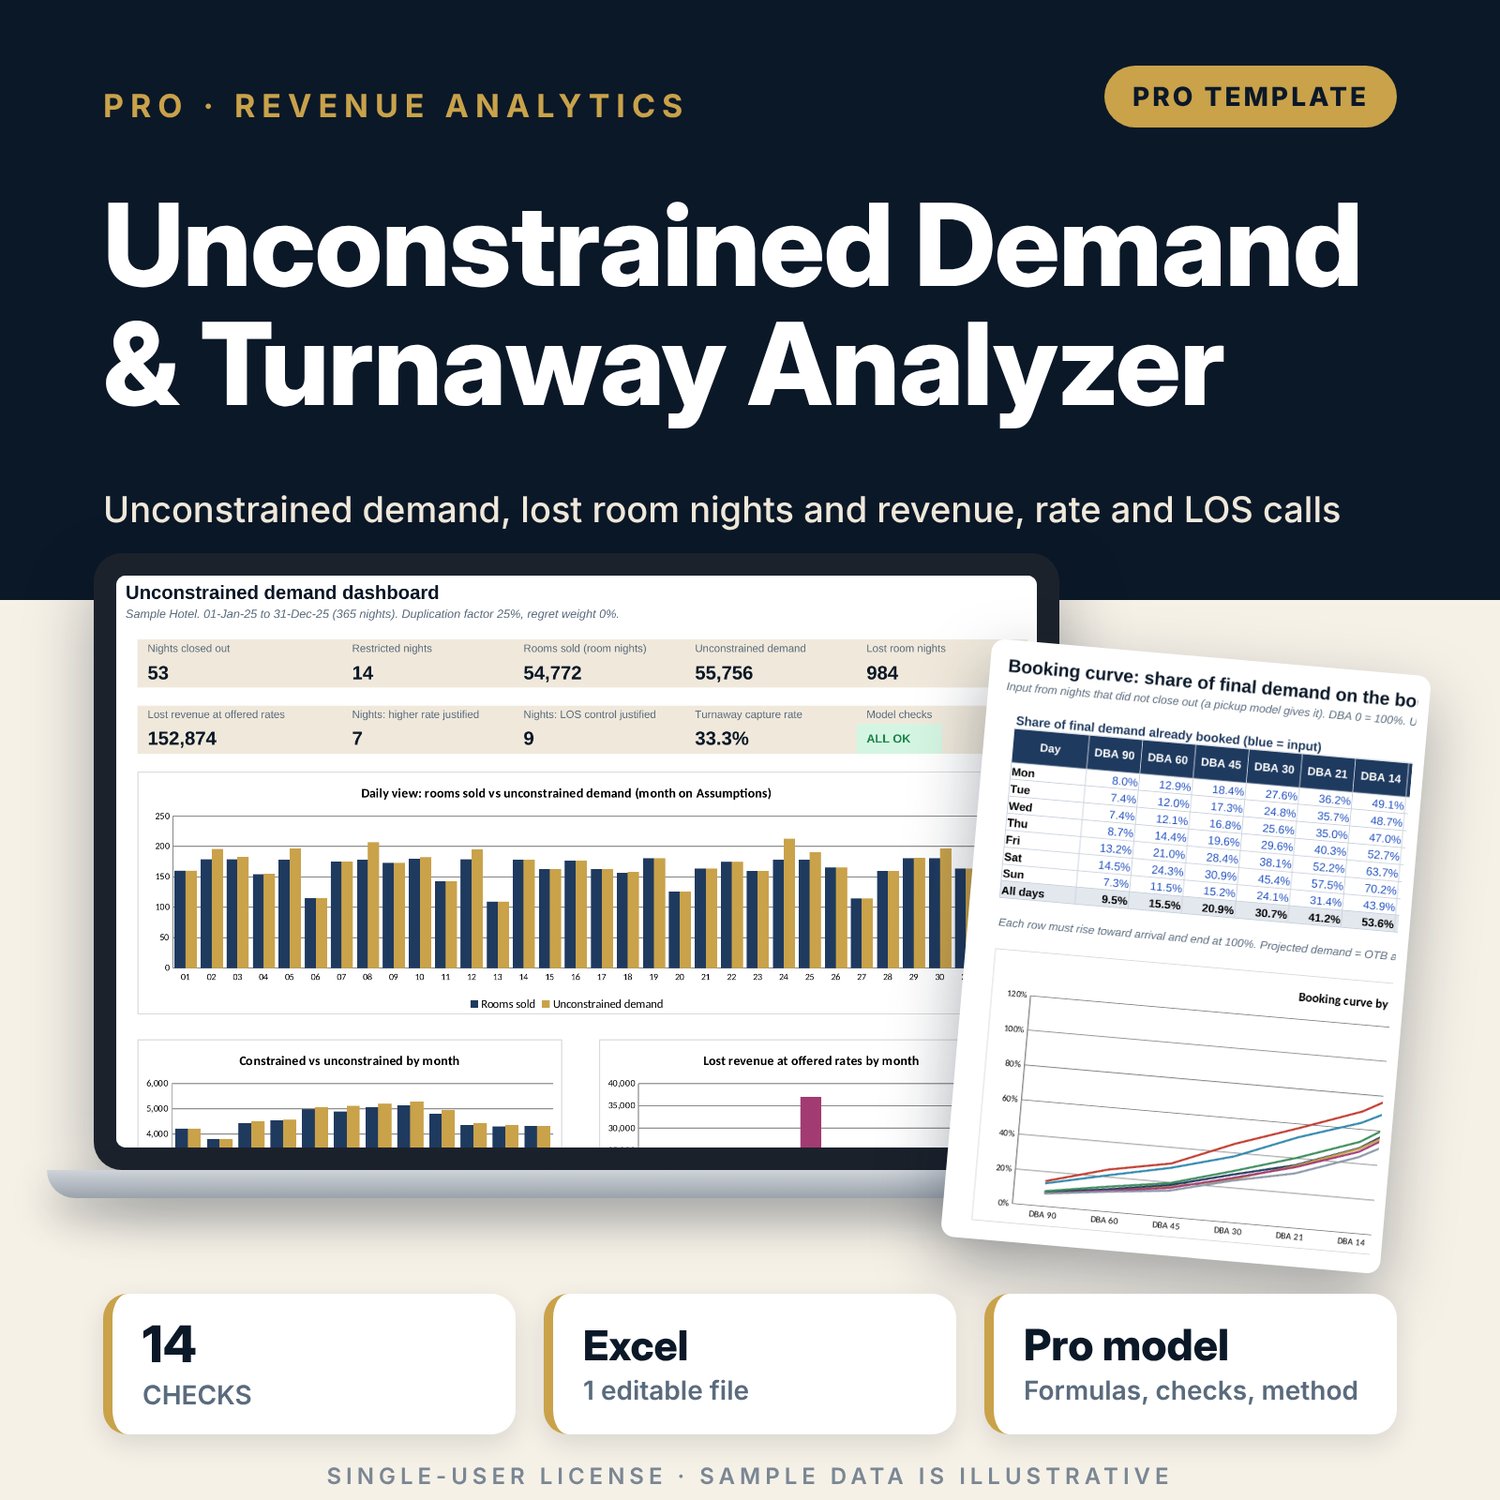
For revenue managers, general managers and directors of sales who need to know how much demand the hotel turned away on sold-out and restricted nights. Rooms sold on a sold-out night only show capacity, so budgets and pricing built on them understate demand. The workbook takes your nights (capacity, rooms sold, close-out flag, the days before arrival when the night closed and the rooms on the books at that moment), a booking curve by day of week and a log of regrets and denials. For each closed night it projects final demand as rooms on the books at close-out divided by the share of demand normally booked by then, interpolated between checkpoints and capped. It adds denials recorded while the night was still open, net of a duplication factor, and uses denials recorded after close-out to validate the projection rather than count them twice. The output is unconstrained demand by night, lost room nights, lost revenue at the offered rate, a monthly view, two sensitivity grids and a list of the nights and weekdays where a higher rate or a length-of-stay control was justified.
Save with a bundle: this workbook is also in the Hotel Revenue & Data Analytics Pro Bundle, 25 workbooks for $59 instead of $319. All 100 Pro workbooks are in the Pro Library for $119, and all 241 templates and workbooks are in the Ultimate Hospitality Library for $149.
What is inside
- Unconstrained_Demand_Turnaway_Analyzer.xlsx: 11 tabs, 16,718 formulas, 5 native charts, 14 drop-down and input rules
- Nights: 365 sample nights (53 closed out, 14 with a stay restriction) and spare rows
- Turnaway_Log: 431 sample regrets and denials with timing, entry checks and counting, room for 600 entries
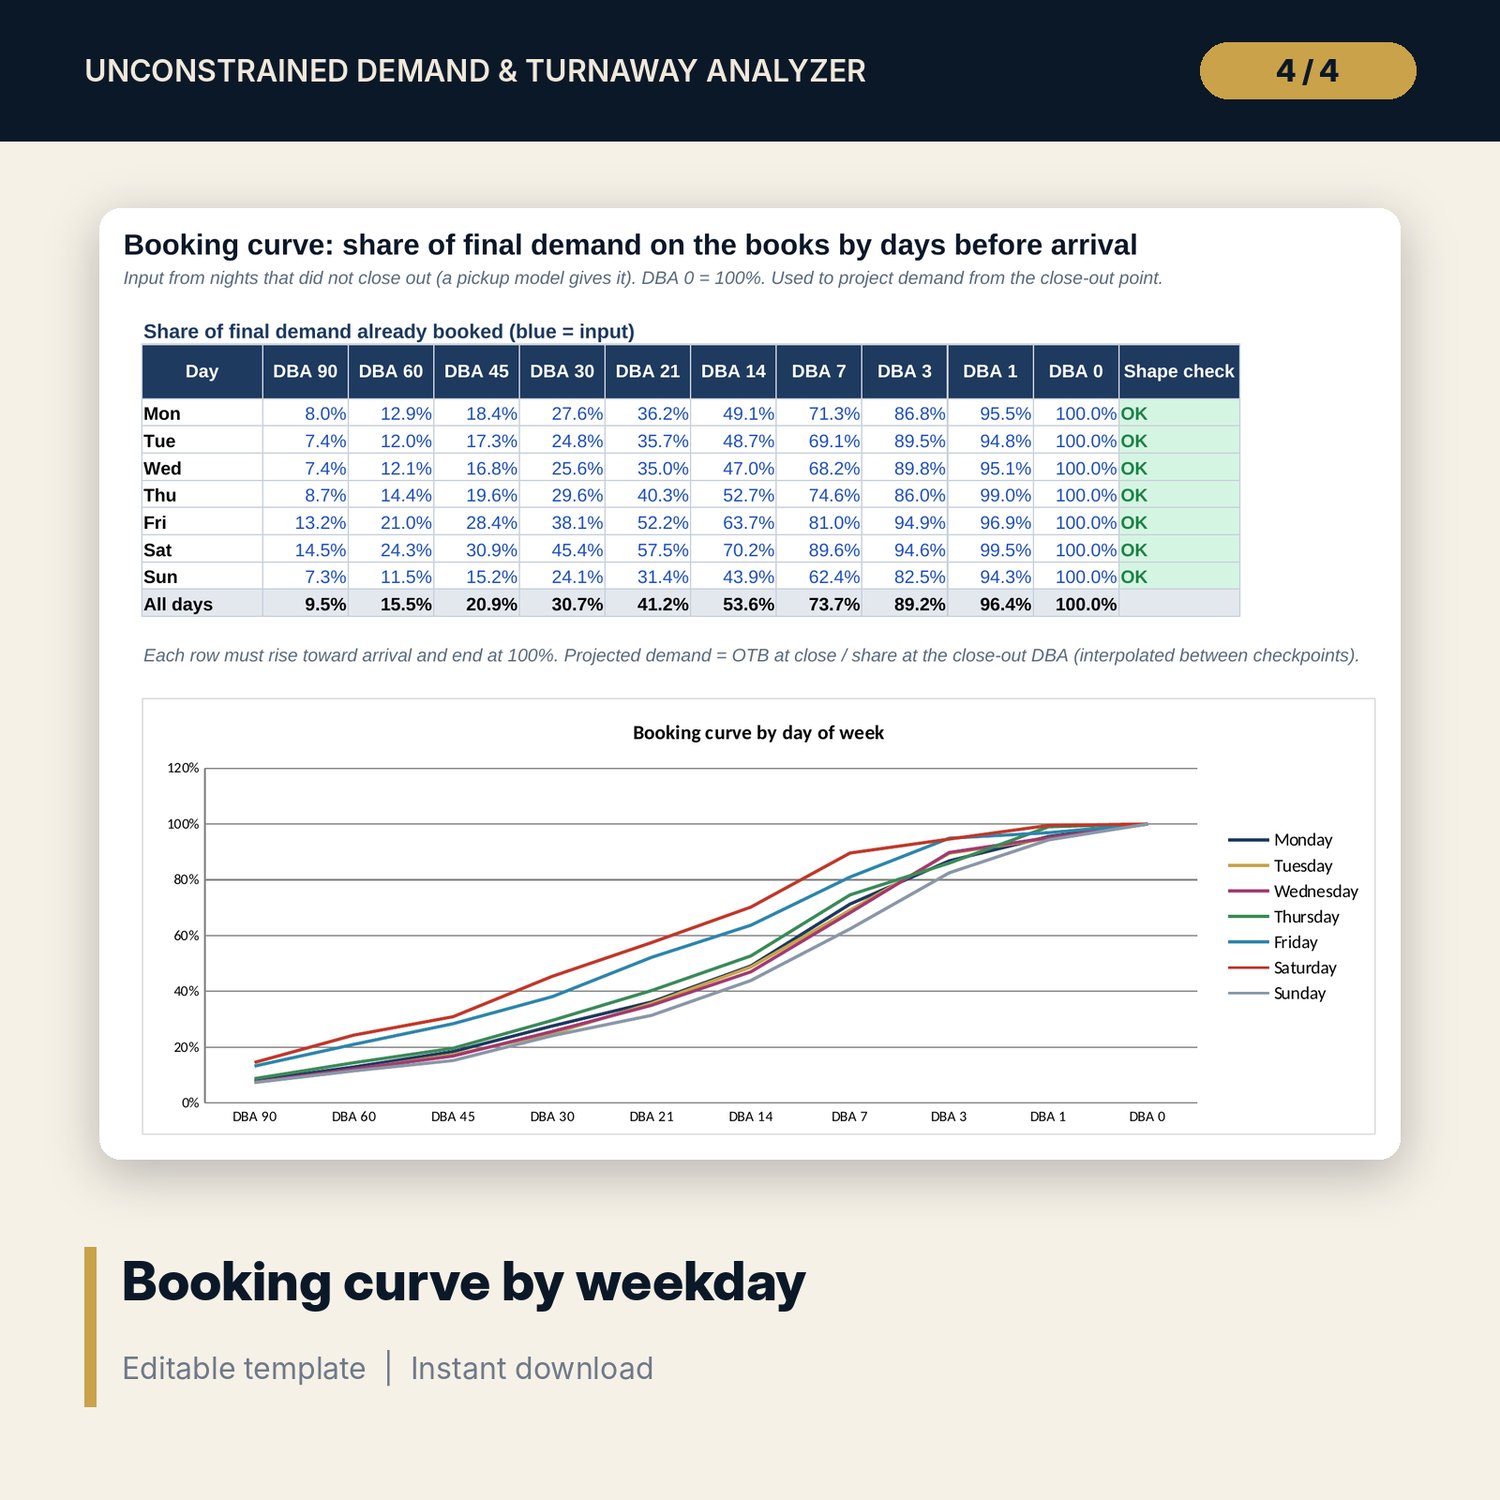
- Booking_Curve: 7 days x 10 checkpoints with a shape check, a chart and an interpolation reading aid
- Unconstrain: the night-by-night engine with every step in its own column
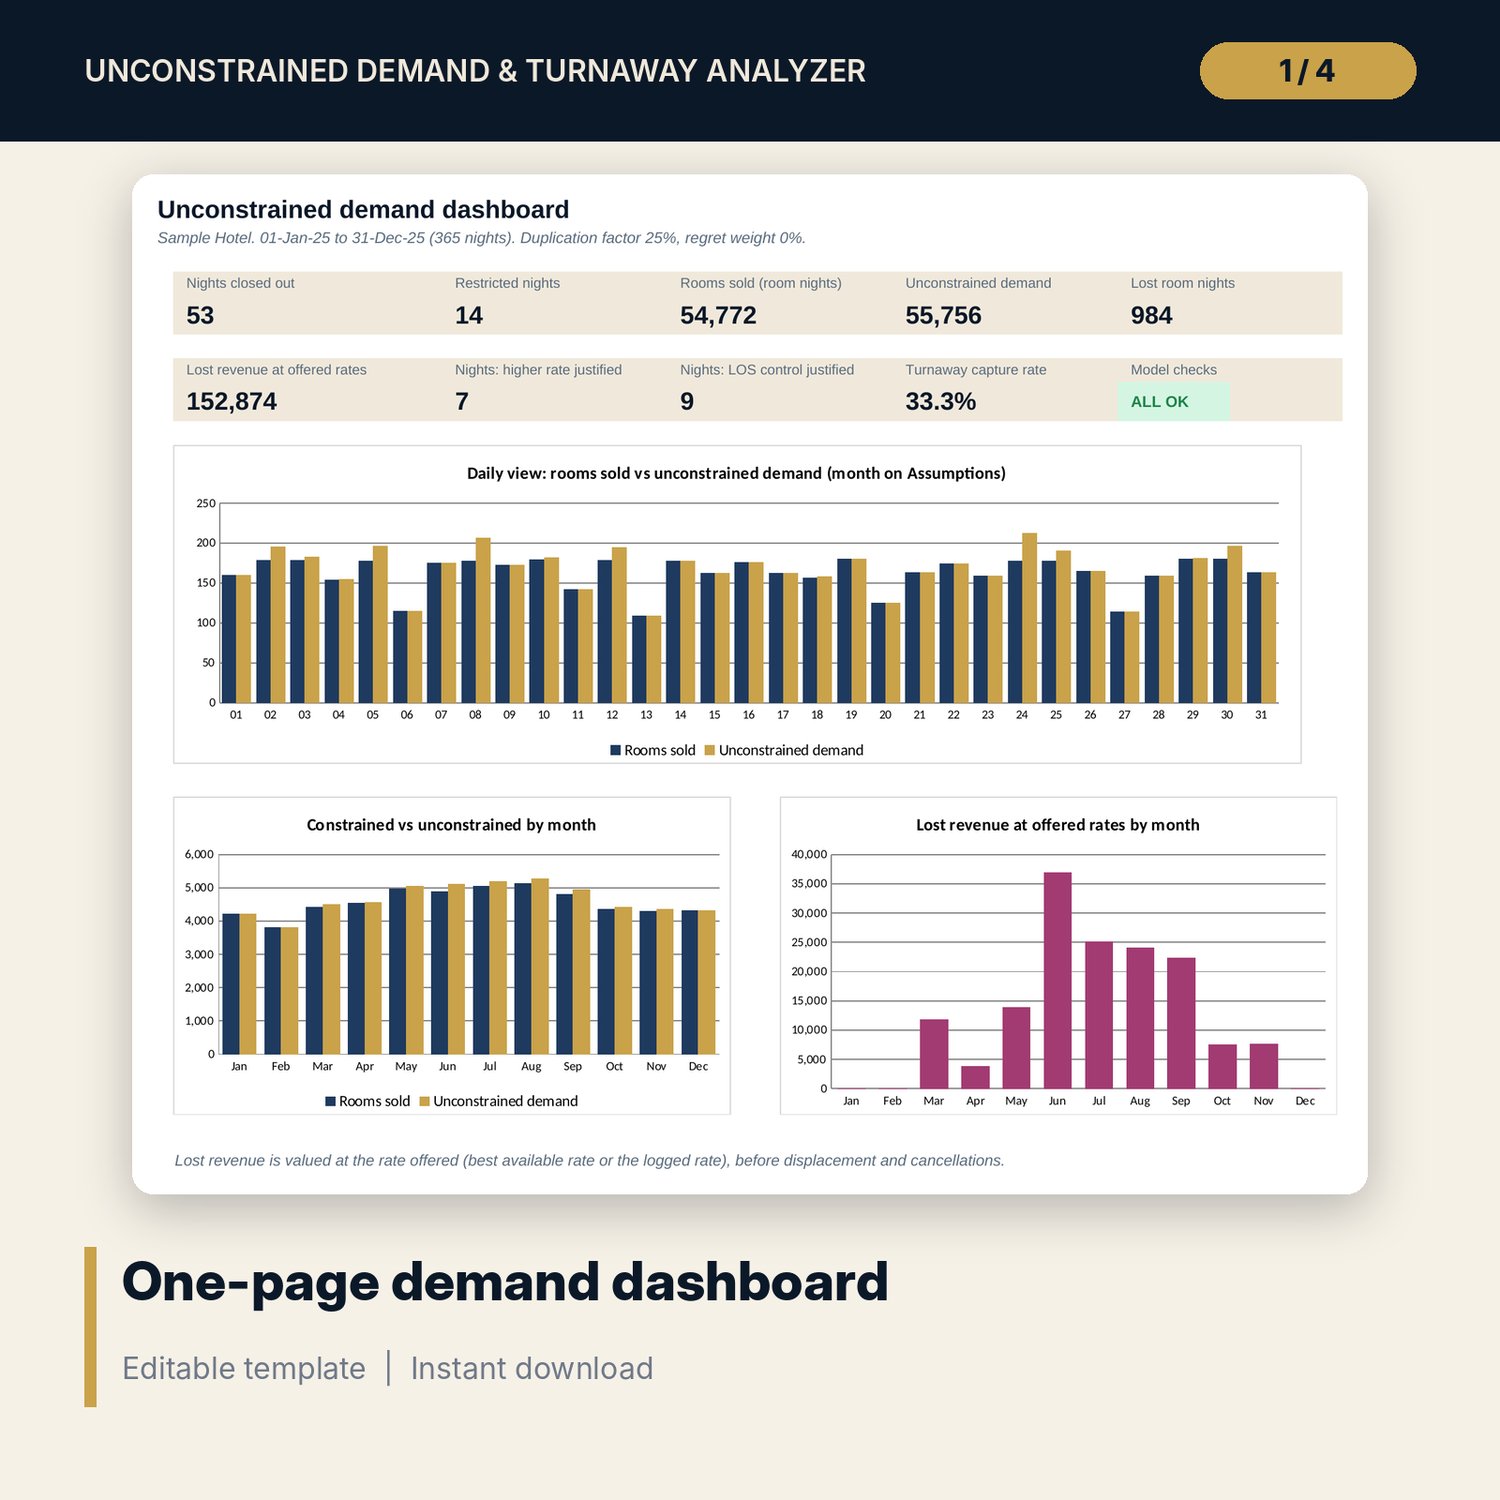
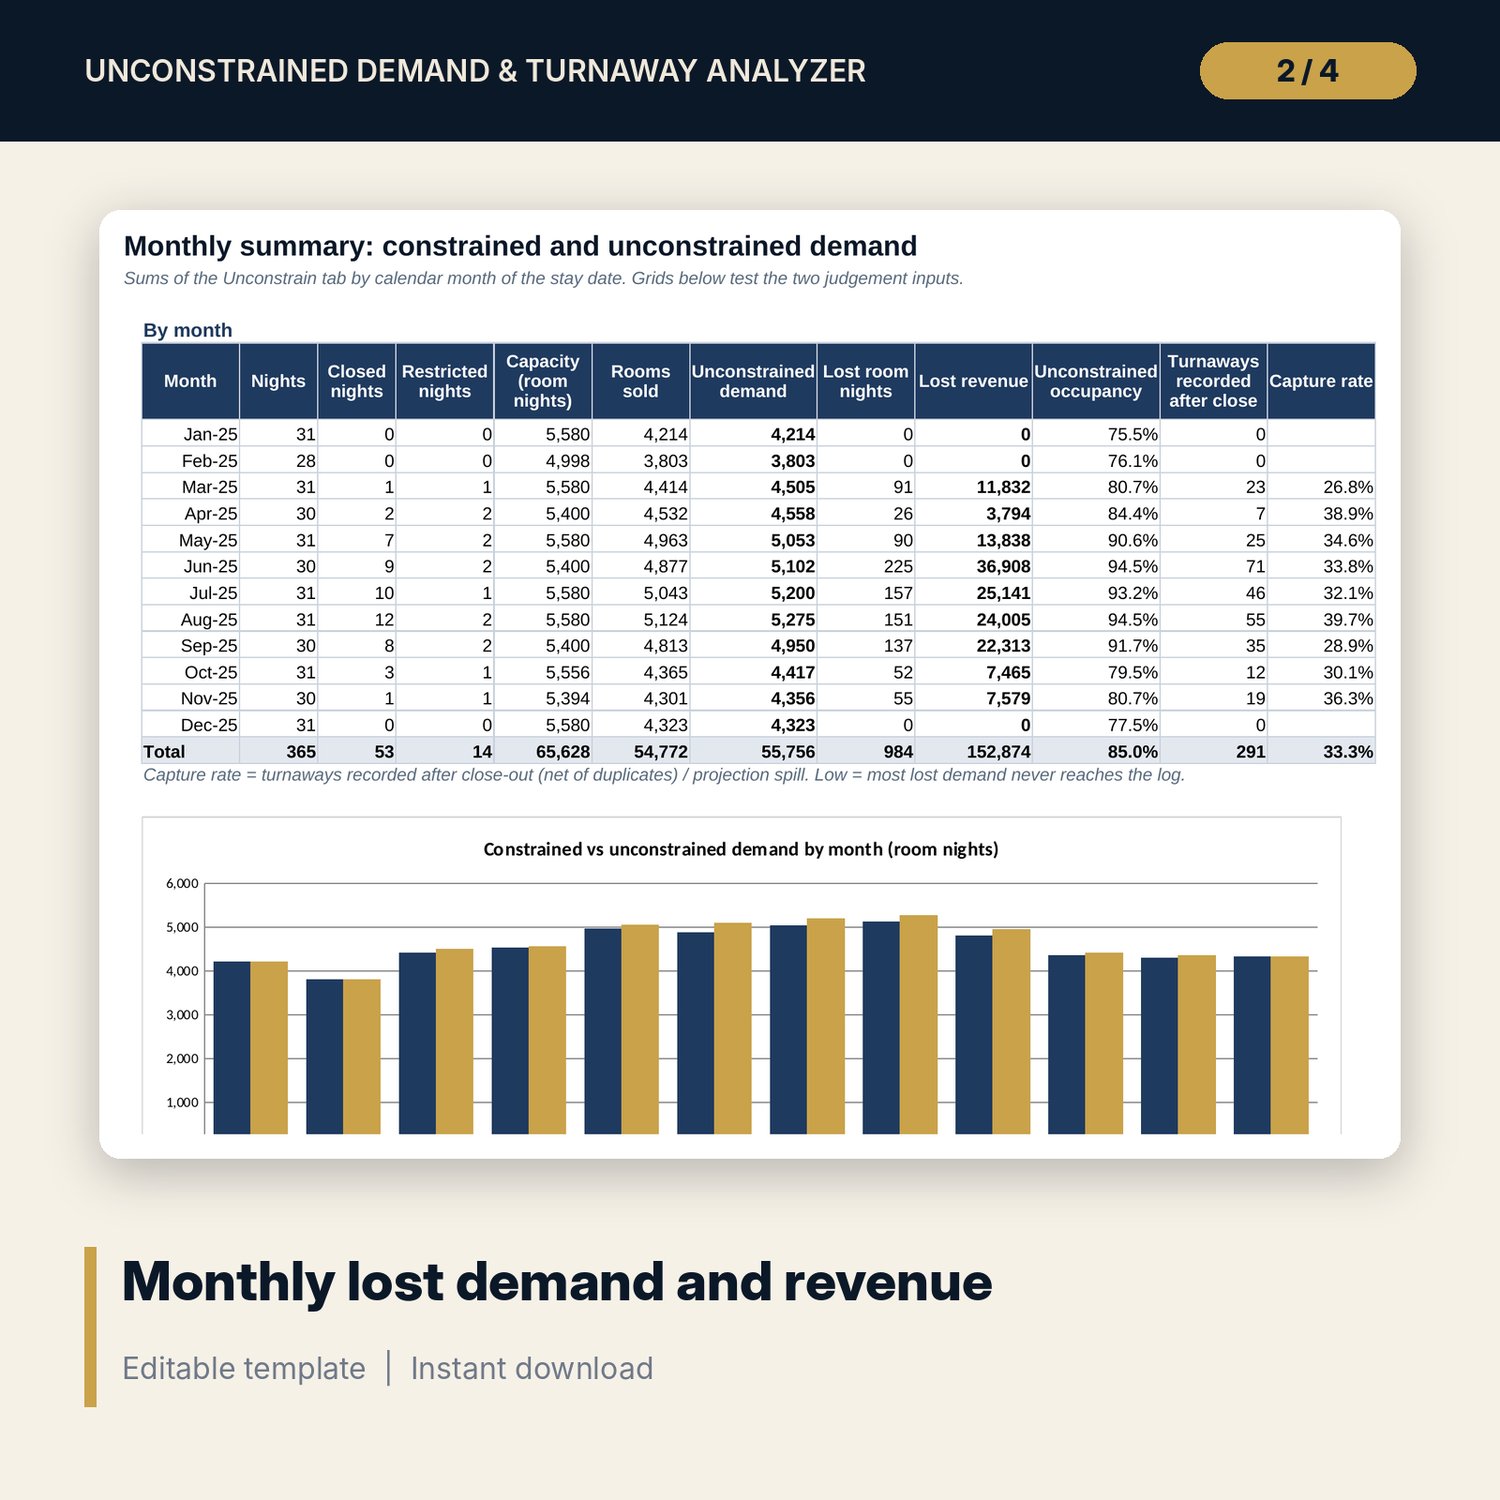
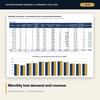
- Monthly: totals by month, constrained vs unconstrained chart, a daily view of any month and two 5 x 5 sensitivity grids
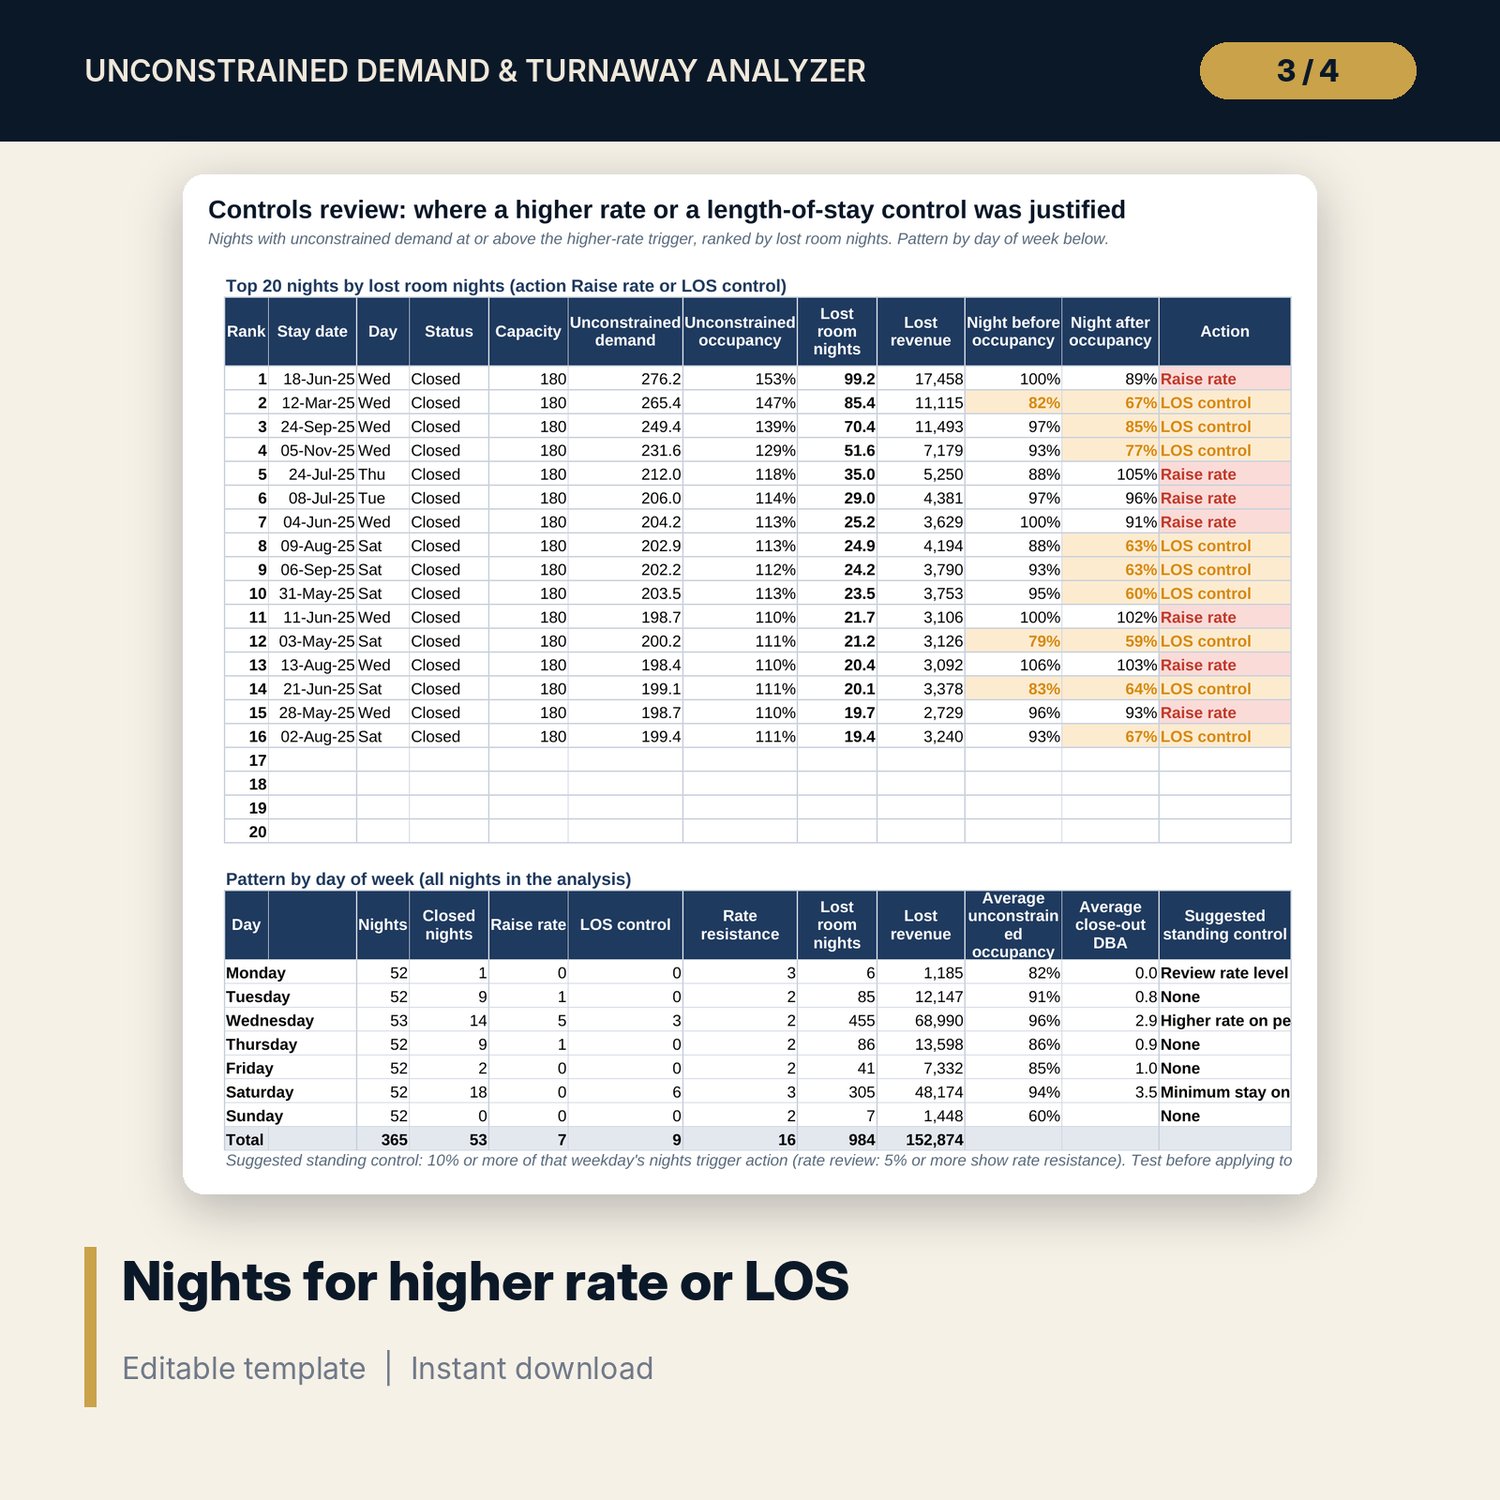
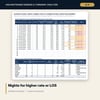
- Controls: top 25 nights for a higher rate or a length-of-stay control and the pattern by day of week
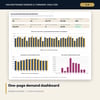
- Dashboard (one printed page), 14 integrity checks and a Method tab with 16 documented calculations
- README.txt and LICENSE-and-Terms.txt
How it works
- Enter the booking curve by day of week from nights that did not sell out.
- Paste one row per night with capacity, rooms sold and, for closed nights, the close-out DBA and the rooms on the books at that moment.
- Paste the regrets and denials log and set the duplication factor and the regret weight.
- Read unconstrained demand, lost room nights and lost revenue by night and month.
- Use the Controls tab to set rates and minimum stays for the next peak, and confirm the Checks tab shows ALL OK.
Details
- Format: one .xlsx workbook, English
- Software: Excel 2016 or later, or LibreOffice Calc 7 or later
- No macros, no data tables, no array formulas, no external links
- Instant digital download
Good to know
- Sample data is illustrative. Replace it with your own figures.
- Unconstrained demand is an estimate. Lost revenue is at the offered rate, before displacement, cancellations and price response.
- Not financial advice. Verify local requirements before you change rates, restrictions or overbooking.
- Single-user license. Do not redistribute.
FAQ
Why not simply add up the turnaway log?
Most lost demand never reaches the log: online visitors who see no availability leave without a trace. The booking-curve projection estimates that demand from the point the hotel closed out; the log adds what the projection cannot see and validates it.
What is the duplication factor?
The share of logged turnaways that are the same guest asking twice, or on two channels. Set it from a sample of your log; the grid shows how much it moves the result.
Are regrets counted as demand?
Not by default. A regret means the guest declined the offered rate. Set a regret weight above 0% to count part of them, or use the Rate resistance flag to review the rate.
Where does the booking curve come from?
From nights that did not sell out: the share of final rooms on the books at 90, 60, 45, 30, 21, 14, 7, 3, 1 and 0 days before arrival. A pickup forecasting model gives it directly.
Does it need macros or add-ins?
No. Every result, including the ranking and the sensitivity grids, is a standard worksheet formula.