
Hotel Segment Mix Optimizer: Hotel Market Segment Mix and Displacement Model in Excel
Full description
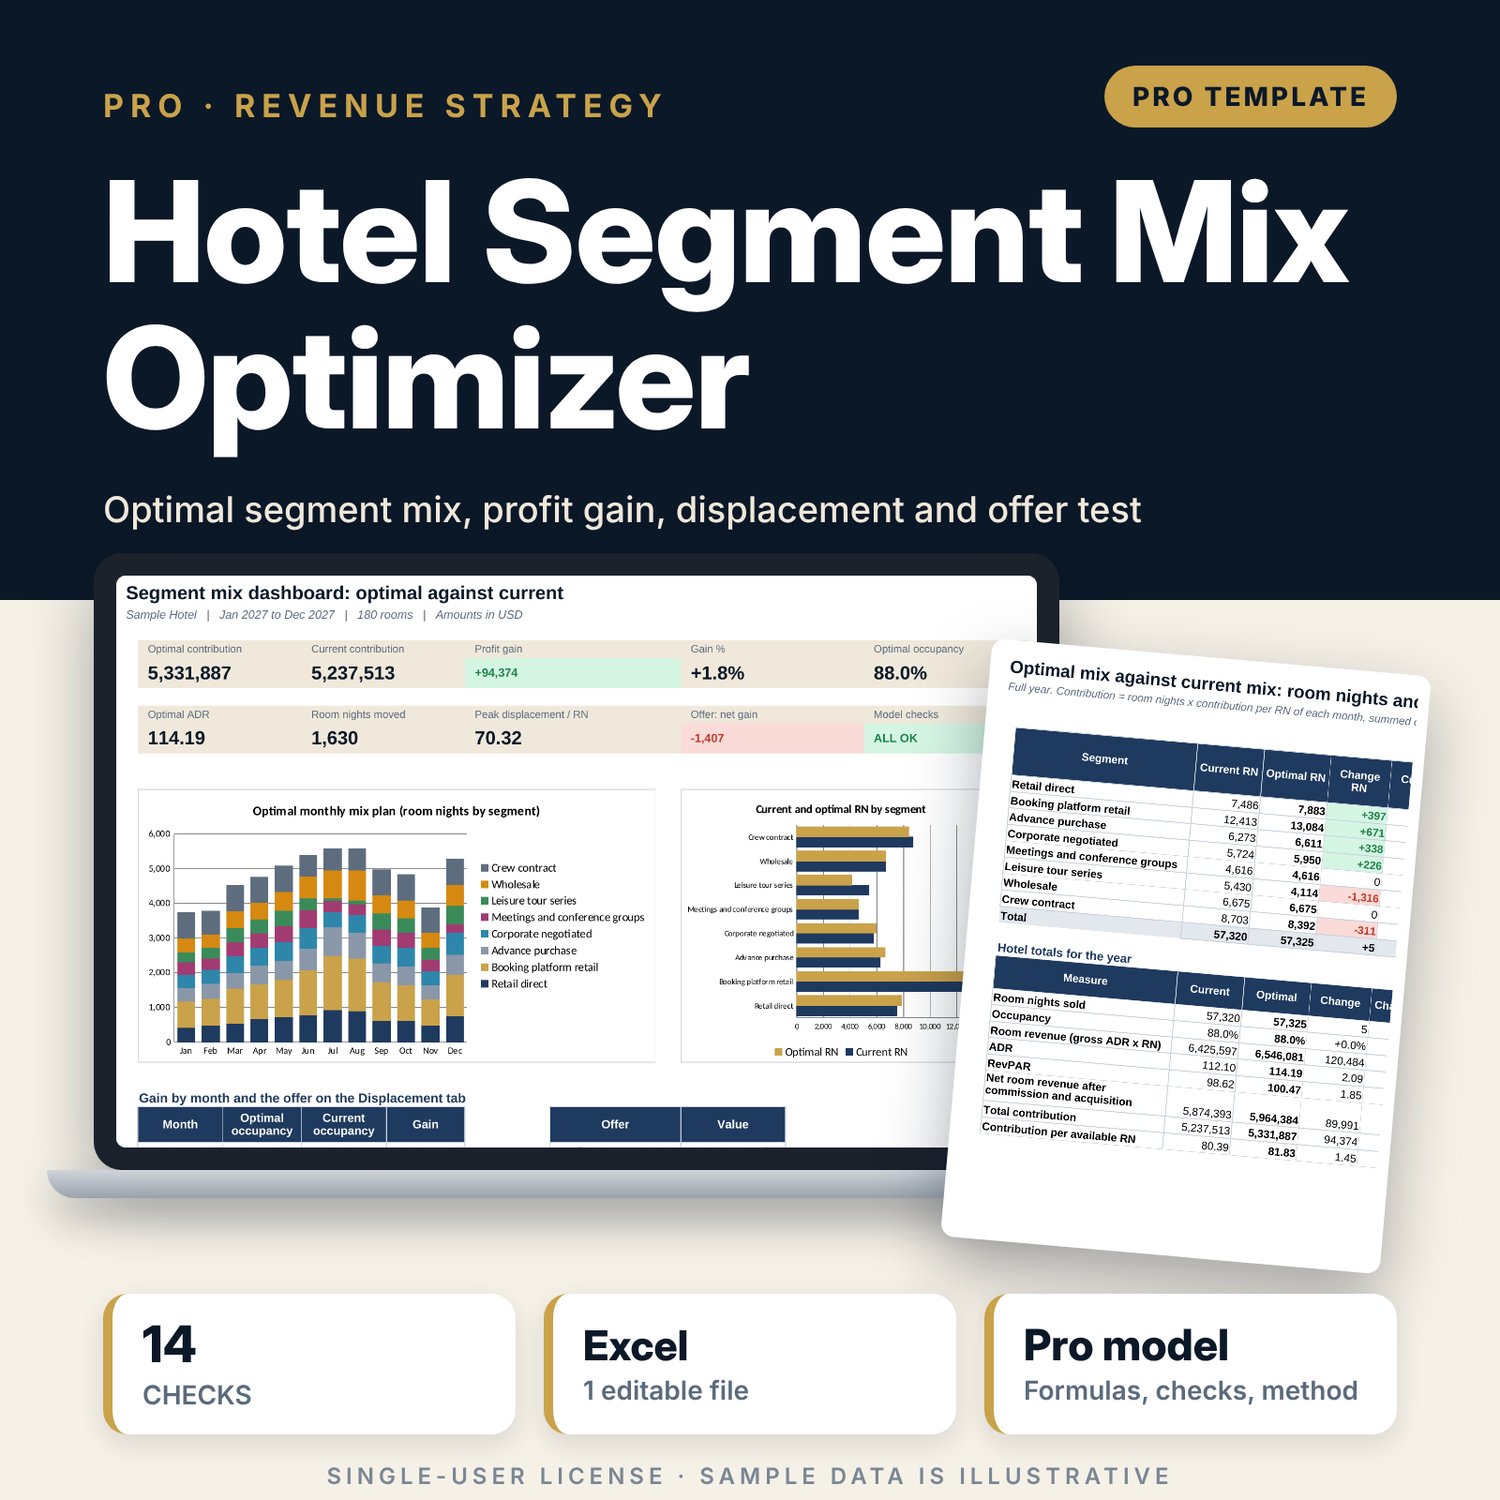
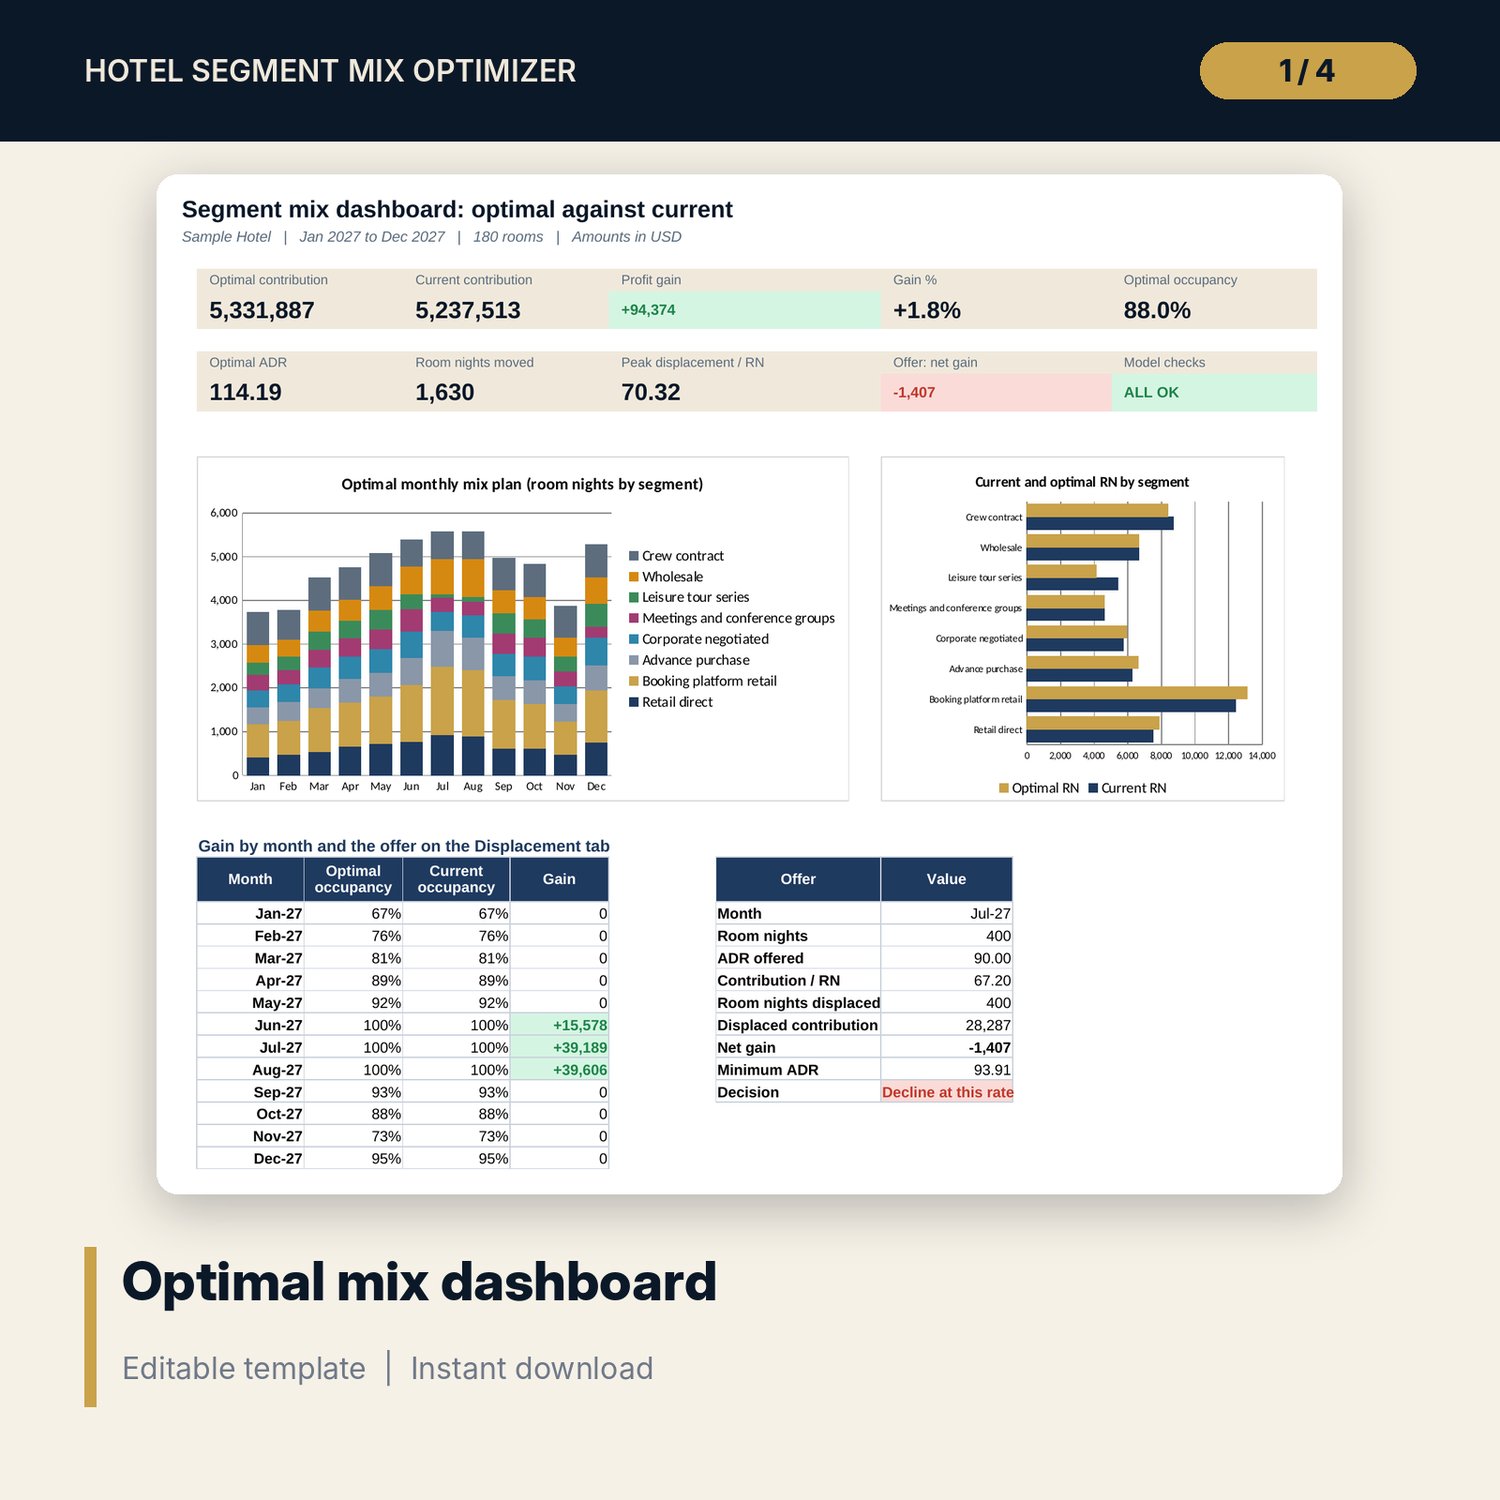
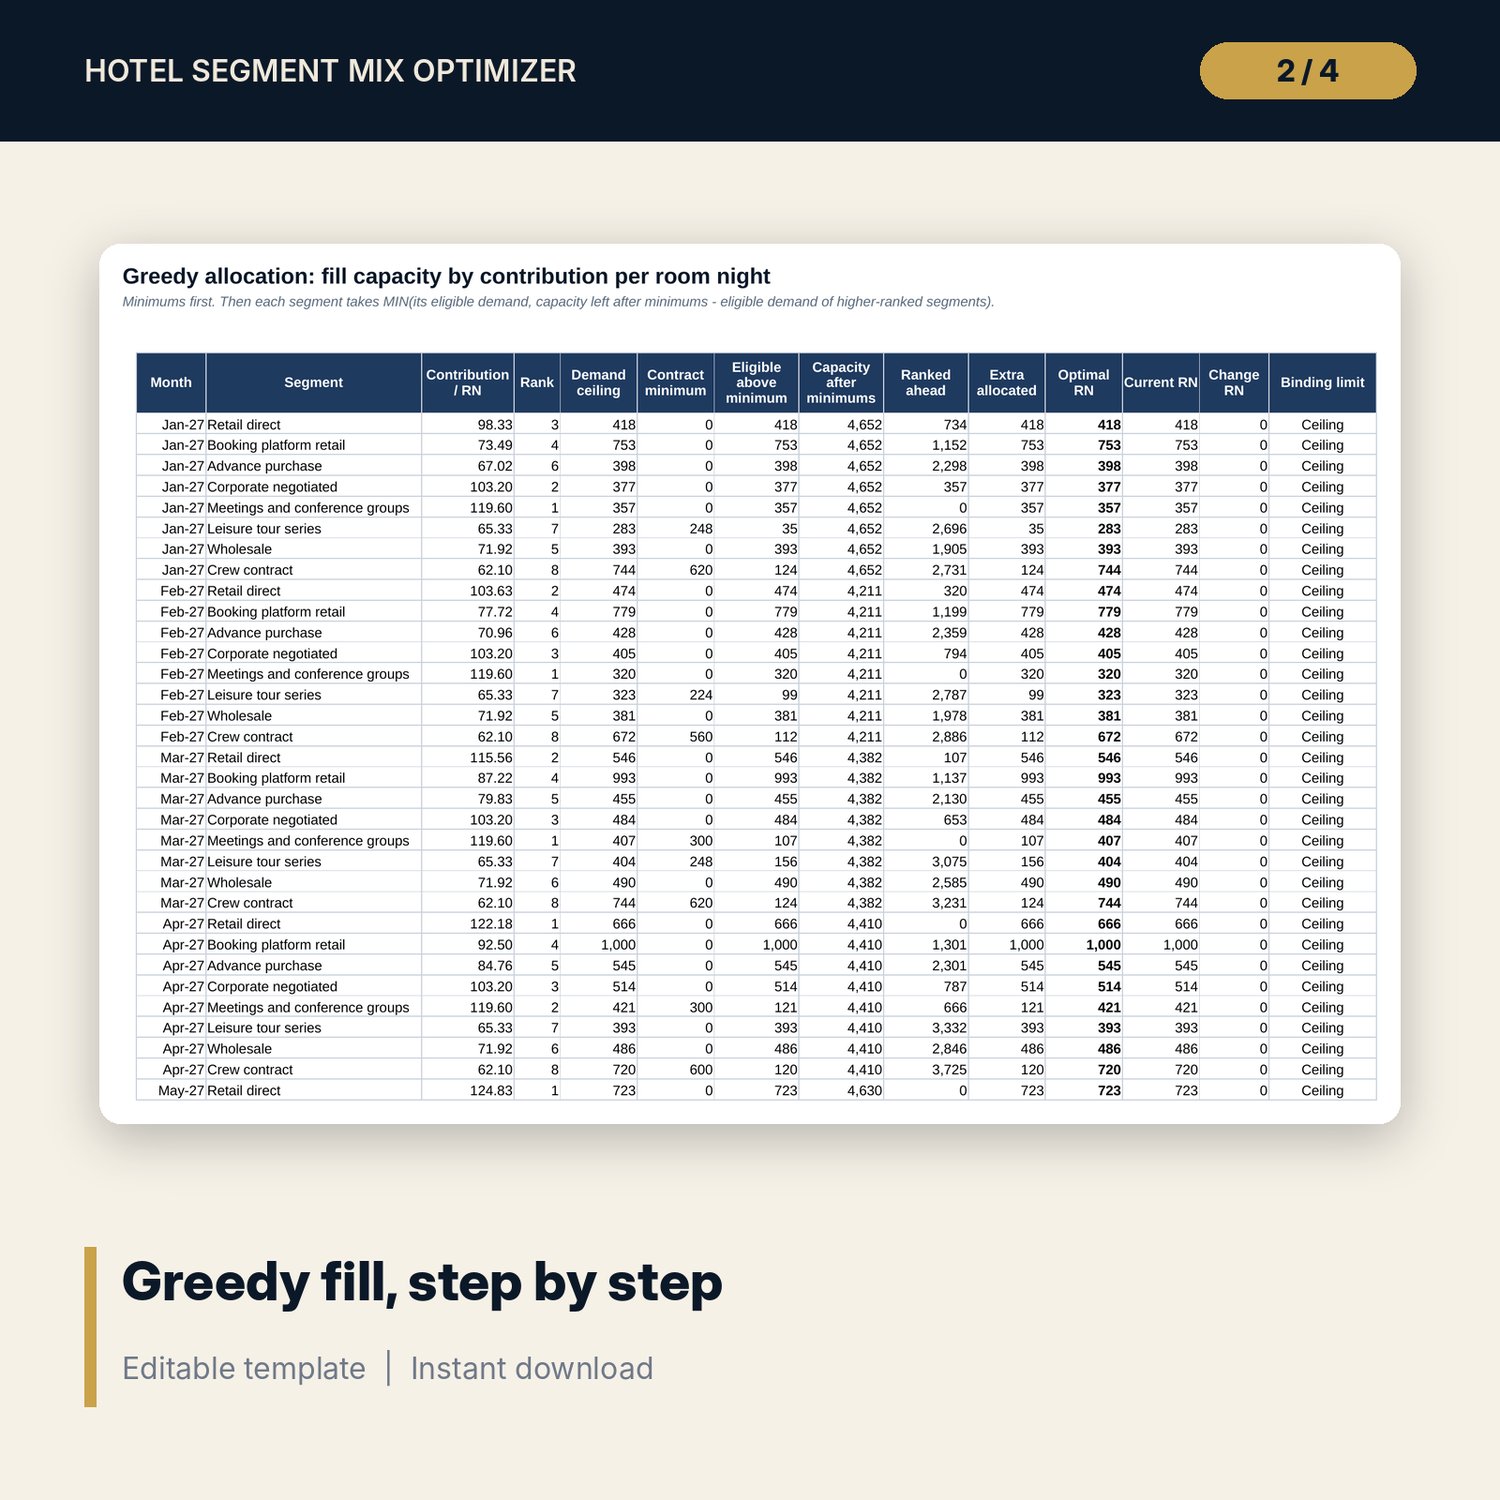
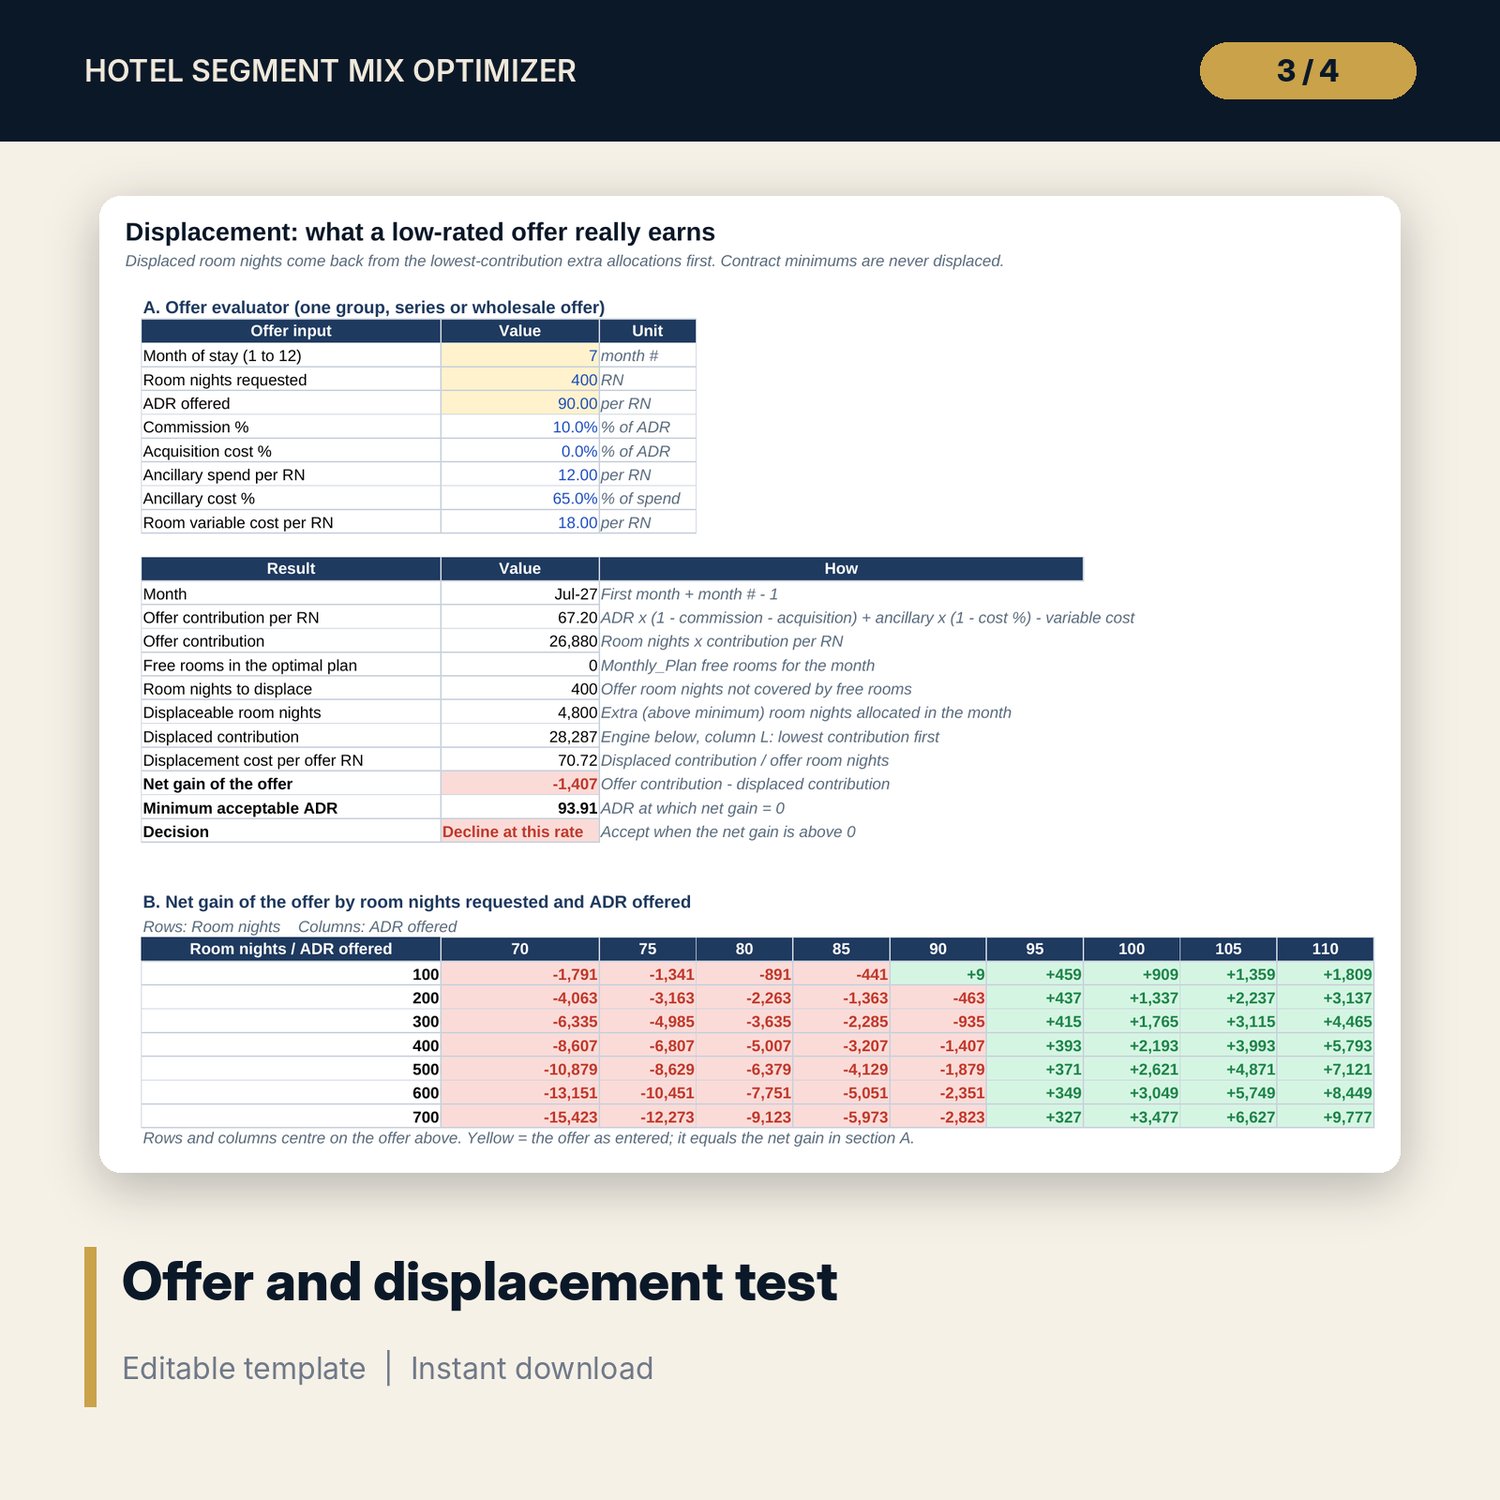
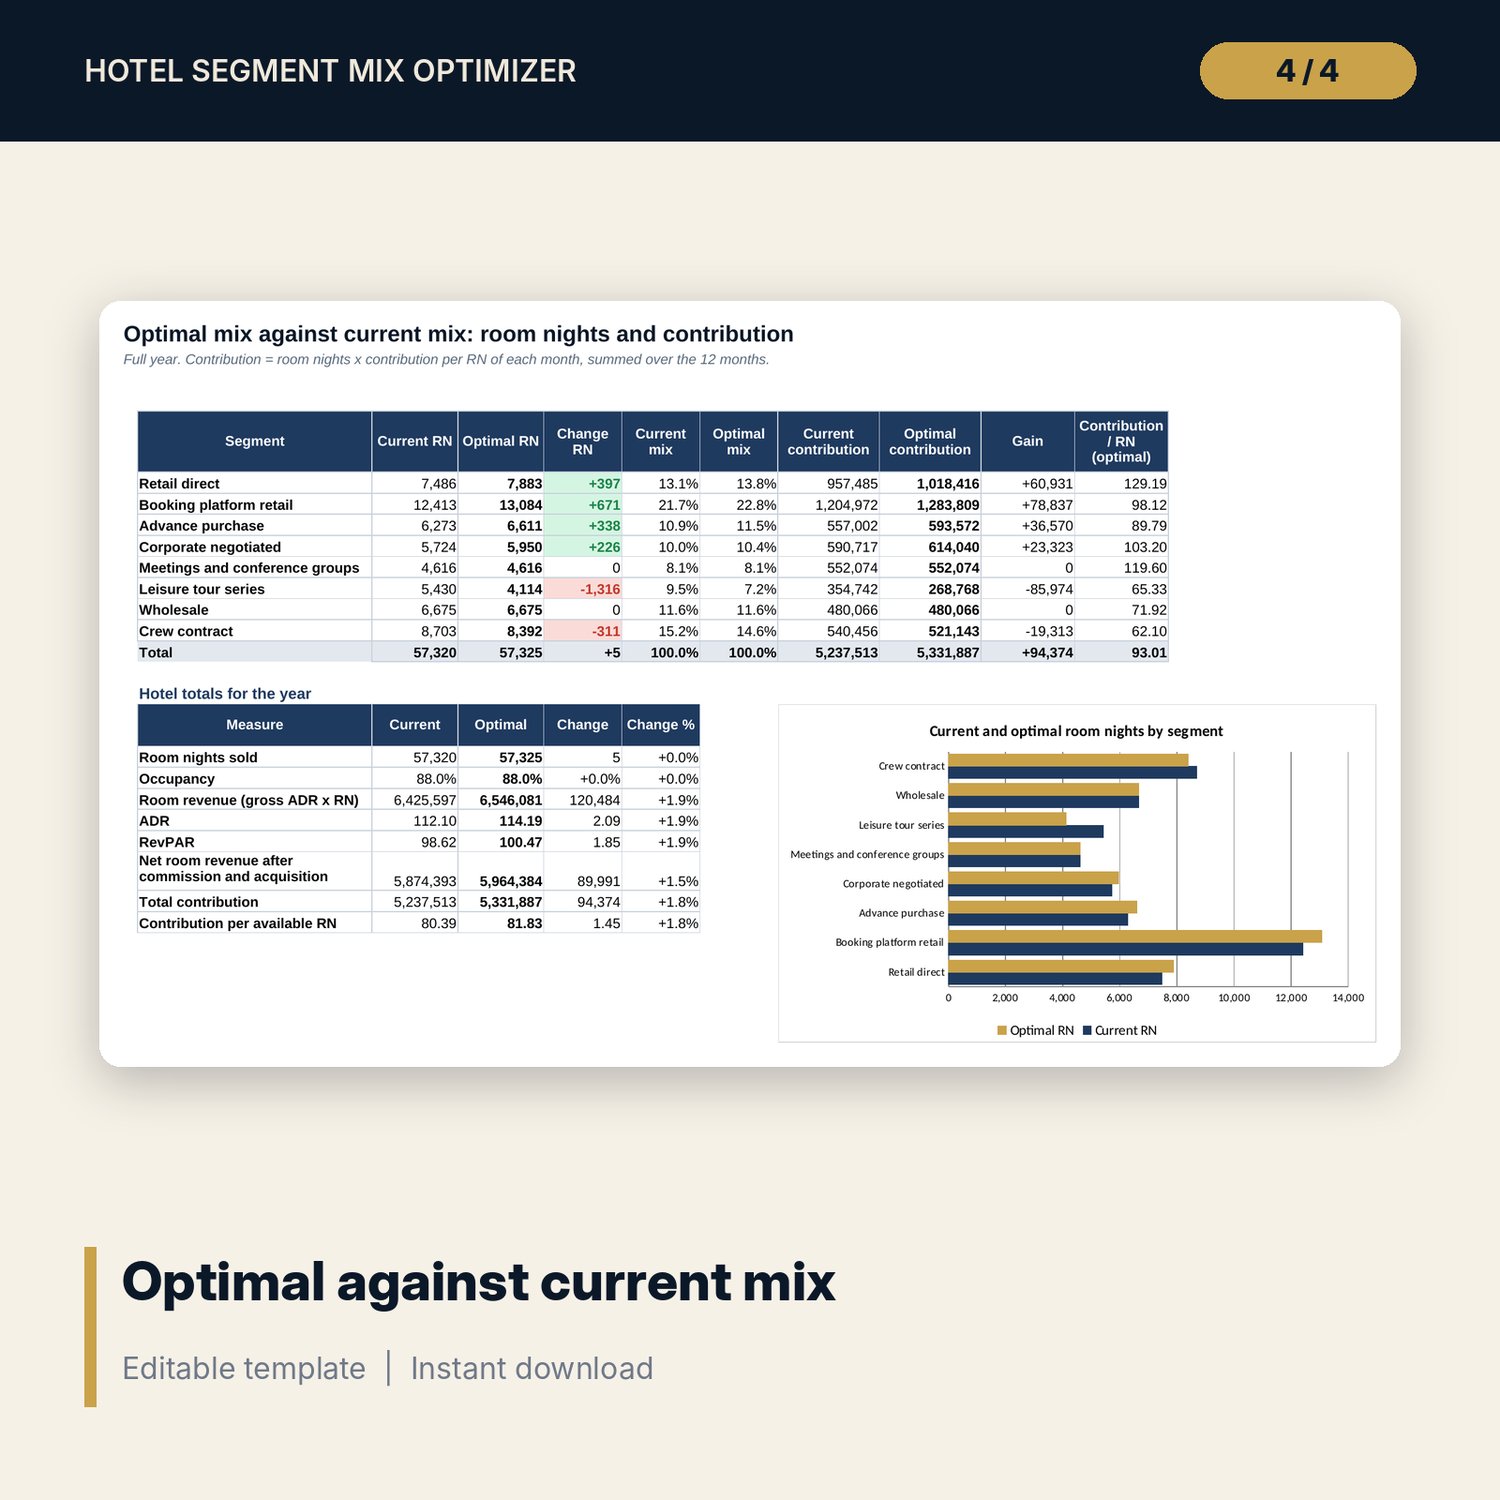
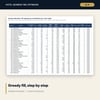
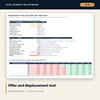
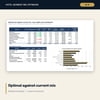
For revenue managers, directors of sales and general managers who must decide how many rooms to give groups, wholesale, crew and corporate contracts against transient demand. Each segment gets a contribution per room night for every month: ADR net of commission and acquisition cost, plus ancillary contribution, minus room variable cost. The model gives every segment its contract minimum, then fills the remaining rooms in order of contribution per room night up to each demand ceiling. With one capacity limit per month this greedy fill is the exact optimum, so it runs on plain formulas with every step visible. You get the optimal mix against your current mix by month and segment, the profit gain, an offer evaluator that shows the contribution an offer displaces and its minimum acceptable ADR, a sensitivity grid of net gain by room nights and rate, and the displacement cost of a test block in every month.
Save with a bundle: this workbook is also in the Hotel Revenue & Data Analytics Pro Bundle, 25 workbooks for $59 instead of $319. All 100 Pro workbooks are in the Pro Library for $119, and all 241 templates and workbooks are in the Ultimate Hospitality Library for $149.
What is inside
- Hotel_Segment_Mix_Optimizer.xlsx: 12 tabs, 4,592 formulas, 5 native charts, 10 drop-down and input rules
- Segments: 8 segments with rate type, base ADR, commission, acquisition cost, ancillary spend and variable cost, plus unit economics and ranking
- Demand: capacity, season index, demand ceiling, contract minimum and current mix for 8 segments x 12 months (288 input cells)
- Unit_Economics and Allocation: 96 rows each (12 months x 8 segments) with every step of the contribution and the greedy fill
- Monthly_Plan and Mix_Compare: optimal against current room nights, occupancy, ADR, RevPAR and contribution, with the gain
- Displacement: offer evaluator, a 7 x 9 sensitivity grid, the test block cost by month and net value by segment and month
- Dashboard (one printed page) with 9 KPI tiles and 2 charts, 14 integrity checks, and a Method tab with 18 documented calculations
- README.txt and LICENSE-and-Terms.txt
How it works
- Enter rooms and the first month on Assumptions, and the rate and cost profile of each segment on Segments.
- On Demand, enter monthly out-of-order room nights, the season index, and each segment's demand ceiling, contract minimum and current mix.
- Read Allocation and Monthly_Plan for the optimal room nights and the binding limit of each segment.
- Compare optimal and current mix on Mix_Compare and Dashboard.
- Test a group, series or wholesale offer on Displacement and read the net gain and minimum acceptable ADR.
Details
- Format: one .xlsx workbook, English
- Software: Excel 2016 or later, or LibreOffice Calc 7 or later
- No macros, no solver, no data tables, no array formulas
- Instant digital download
Good to know
- Sample data is illustrative. Replace it with your own forecast and contracts.
- The model works on monthly room-night totals. Peak nights inside a month can sell out before the month does, so check night-level displacement for large groups.
- Contribution is room-night profit before fixed costs. It is a planning tool, not financial advice. Verify local requirements and your own contract terms.
- Single-user license. Do not redistribute.
FAQ
Why does a greedy fill give the best mix?
Each month has one capacity limit and each segment a minimum and a ceiling. Under those conditions filling in order of contribution per room night gives the highest total, so no solver is needed.
Can I change the segments?
Yes. Rename the 8 segments and change their rate and cost profile on Segments. The model is built for exactly 8 segment slots.
How is displacement measured?
Extra room nights come back from the lowest-contribution segments first, never from contract minimums. The displaced contribution is compared with what the offer earns.
What if my current mix breaks a ceiling or a minimum?
The Demand tab flags it, and the comparison still runs. The gain then includes the effect of moving back inside your own forecast limits.
Does it need macros or add-ins?
No. Every result is a standard worksheet formula, including the sensitivity grid.