


Hotel Price Elasticity & Optimal Rate Calculator: Price Elasticity of Demand Model for Hotel Room Rates
Full description
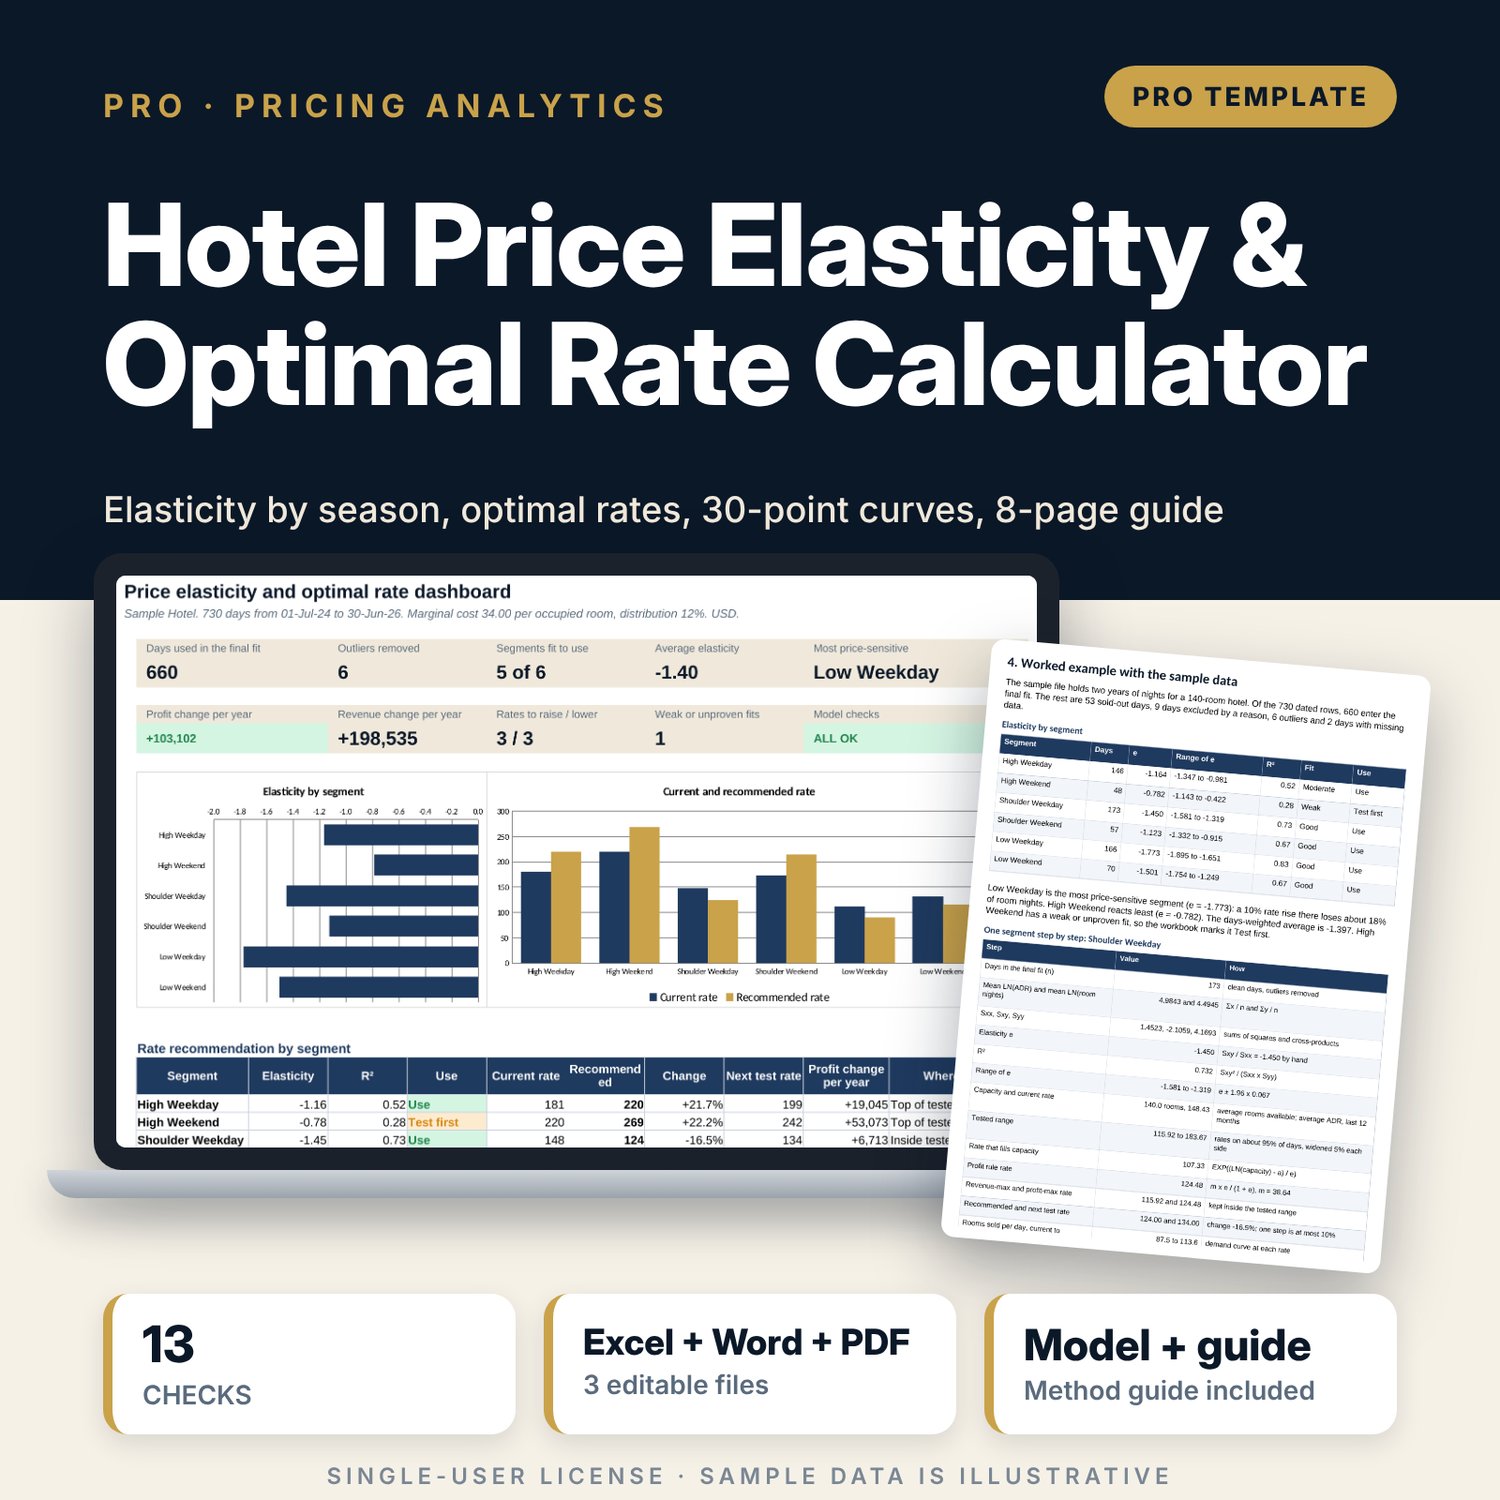
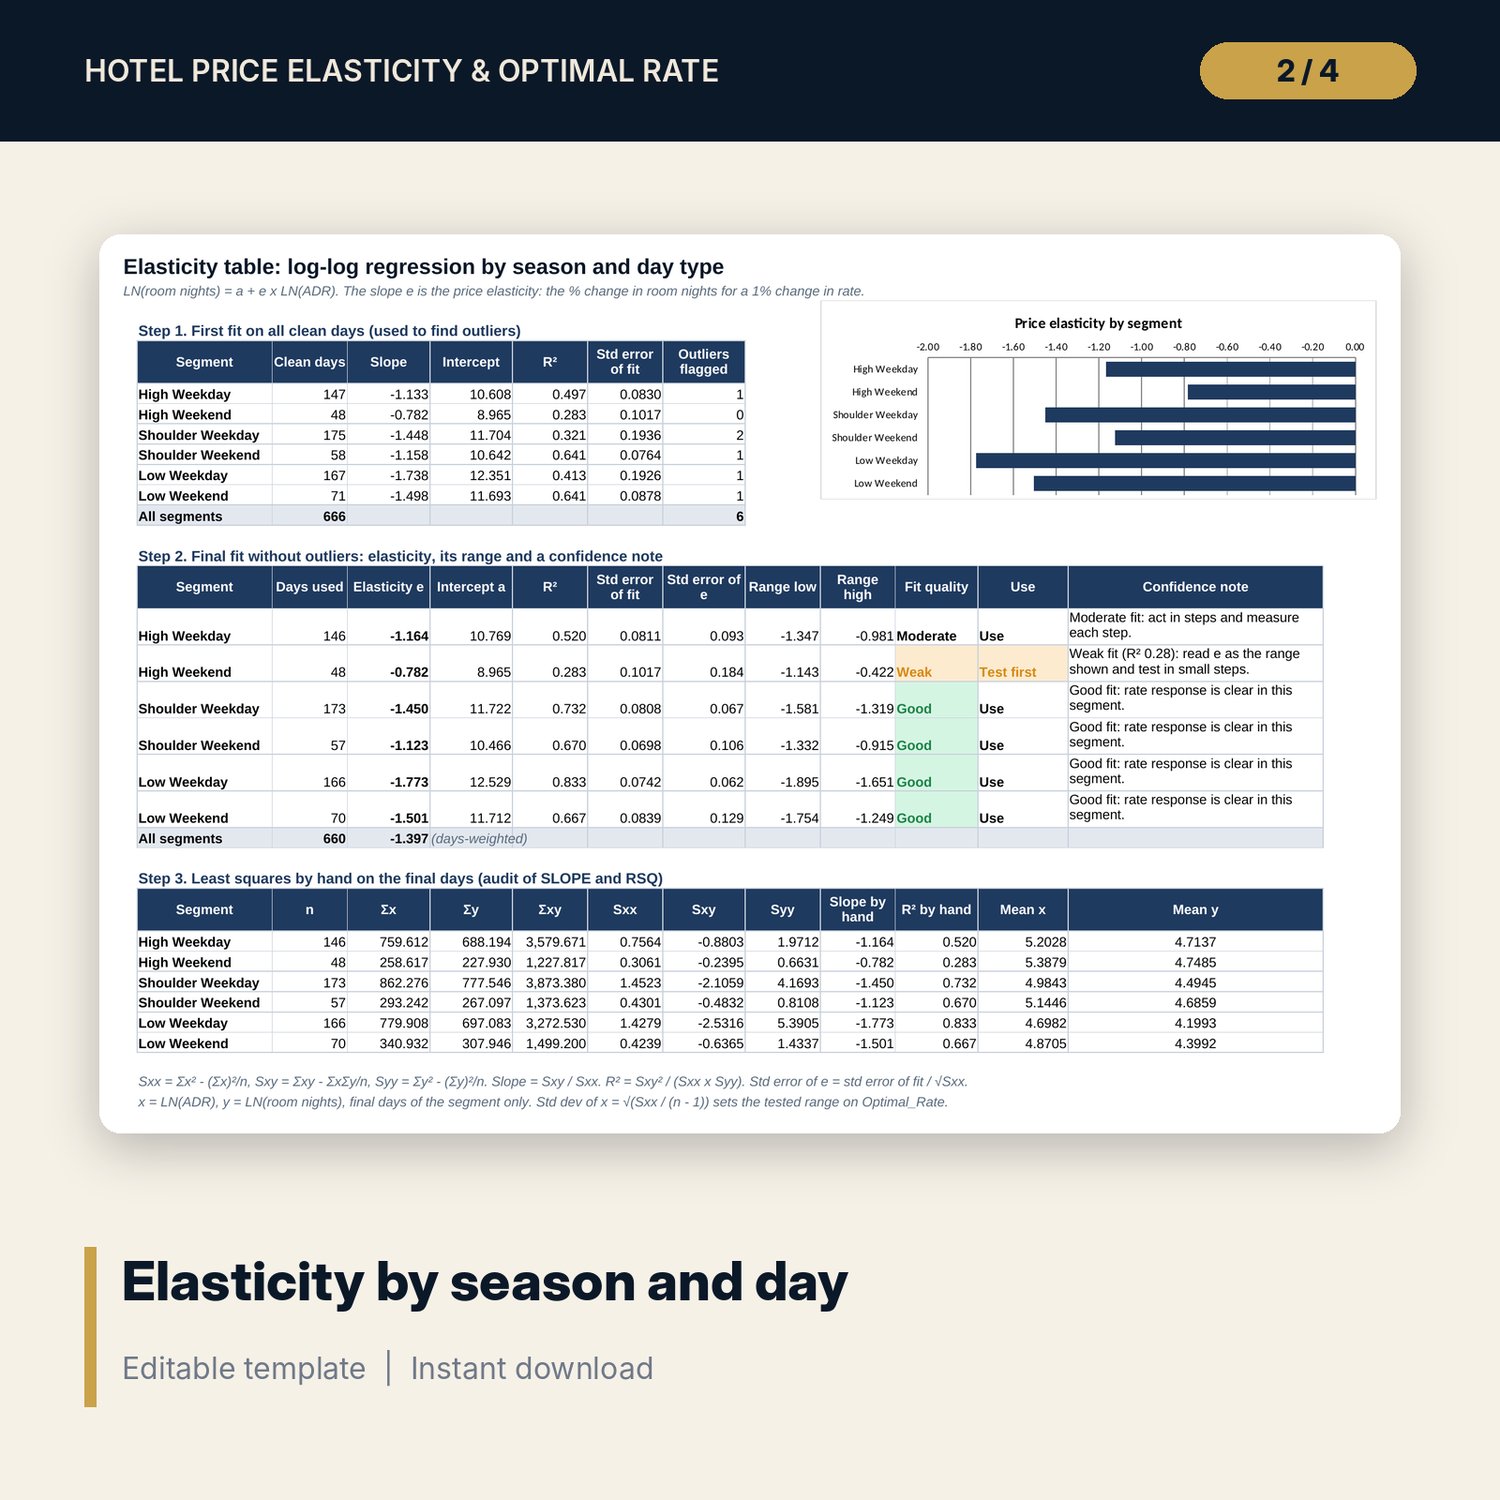
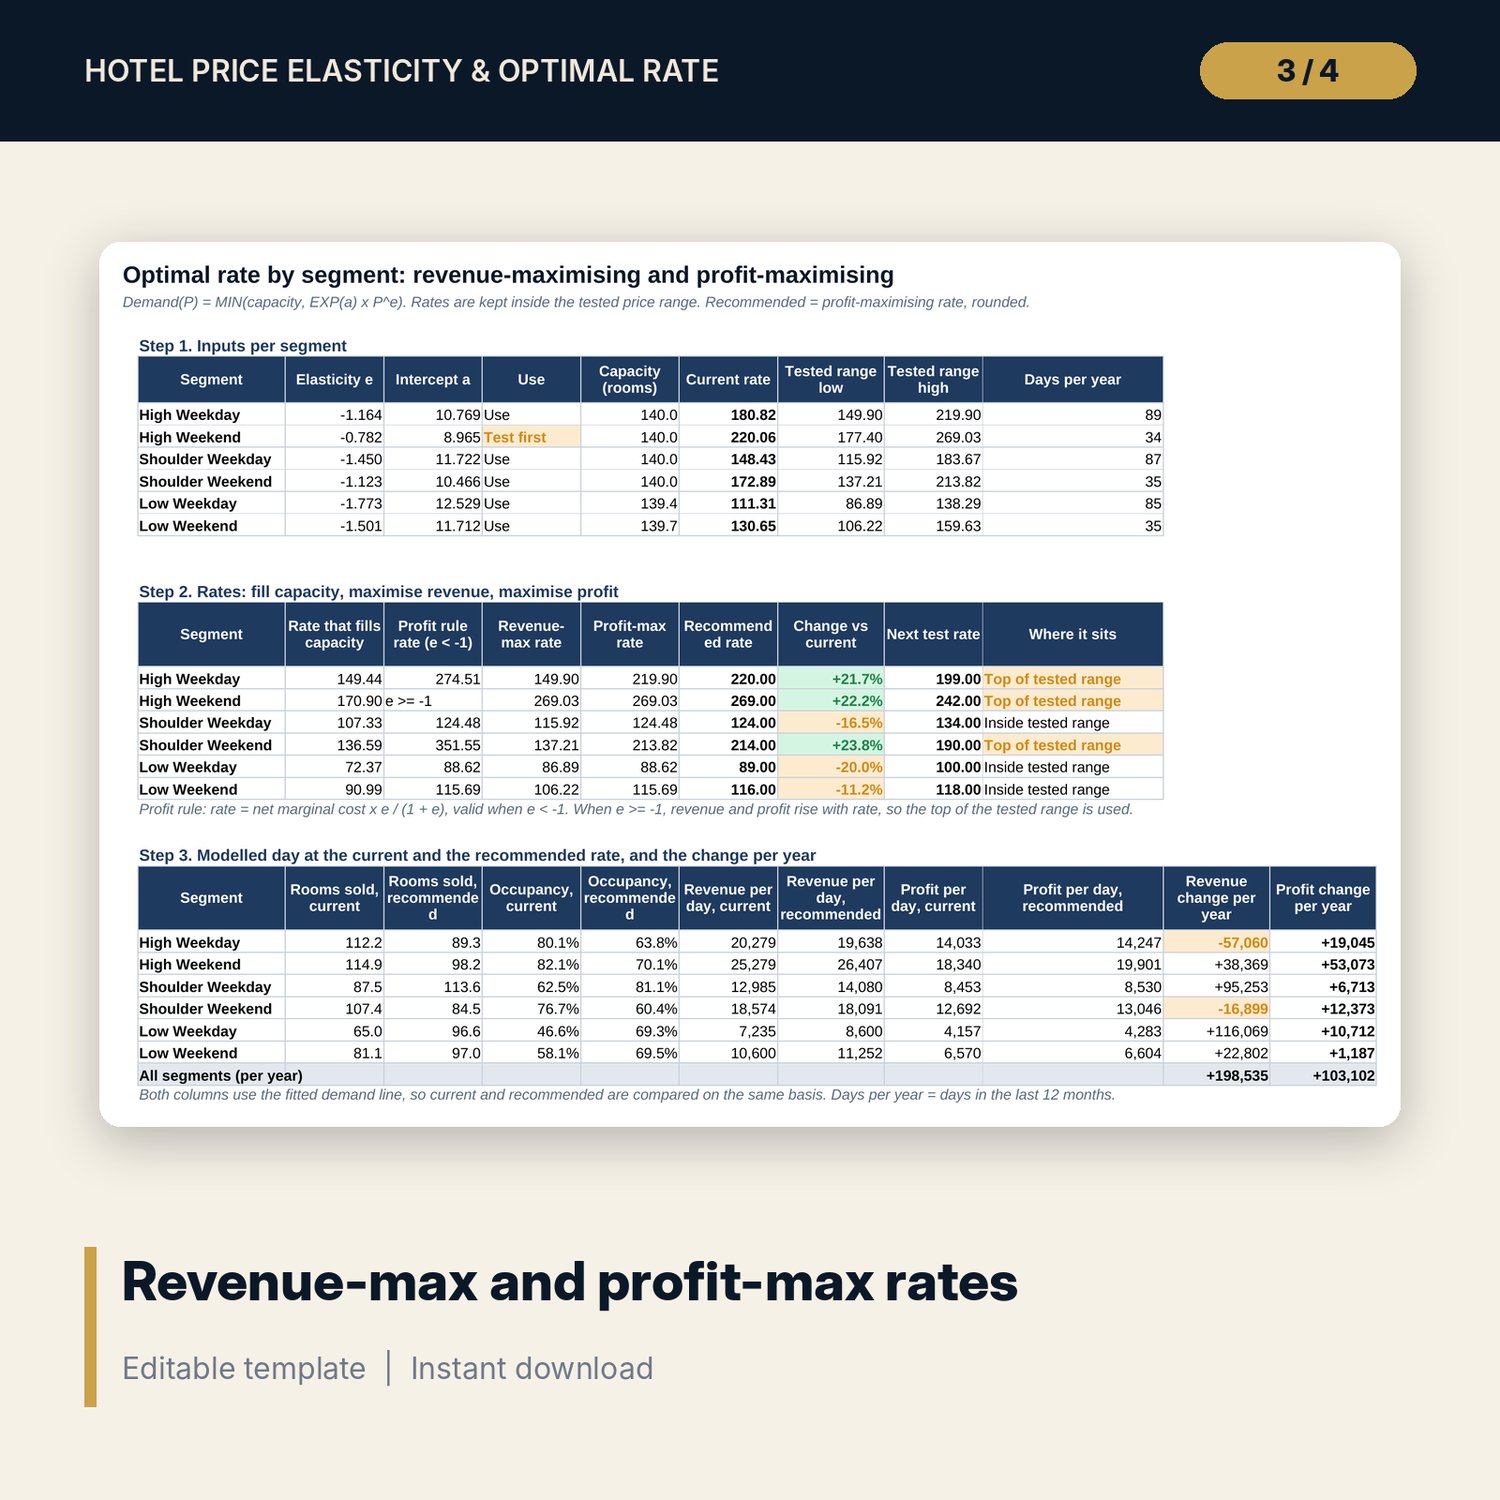
For revenue managers, general managers and commercial directors who want evidence before they move a rate. The workbook takes up to 760 nights of rooms available, room nights sold and ADR, splits them into 6 pricing segments (3 seasons x weekday or weekend) and fits LN(room nights) on LN(ADR) per segment with SLOPE, INTERCEPT, RSQ and STEYX. Sold-out days, excluded event days and missing data are left out; a first fit finds days more than 2.5 standard errors from the line, and a second fit without them gives the elasticity, its confidence range, R² and a plain confidence note when the fit is weak. Each elasticity becomes a demand curve capped at capacity, the rate that fills capacity, a revenue-maximising rate and a profit-maximising rate that uses your marginal cost per occupied room and distribution cost, all kept inside the price range your data covers. A 30-point price curve per segment, two sensitivity grids and a next test rate limit each move to a step you can measure.
Save with a bundle: this workbook is also in the Hotel Revenue & Data Analytics Pro Bundle, 25 workbooks for $59 instead of $319. All 100 Pro workbooks are in the Pro Library for $119, and all 241 templates and workbooks are in the Ultimate Hospitality Library for $149.
What is inside
- Hotel_Price_Elasticity_Optimal_Rate_Calculator.xlsx: 12 tabs, 25,491 formulas, 5 native charts, 13 drop-down and input rules
- Daily_Data: 730 sample nights (2 years) with status flags and room for 760
- Fit_Engine: log transforms, first fit, standardised residuals, outlier flags and the final-fit data, row by row
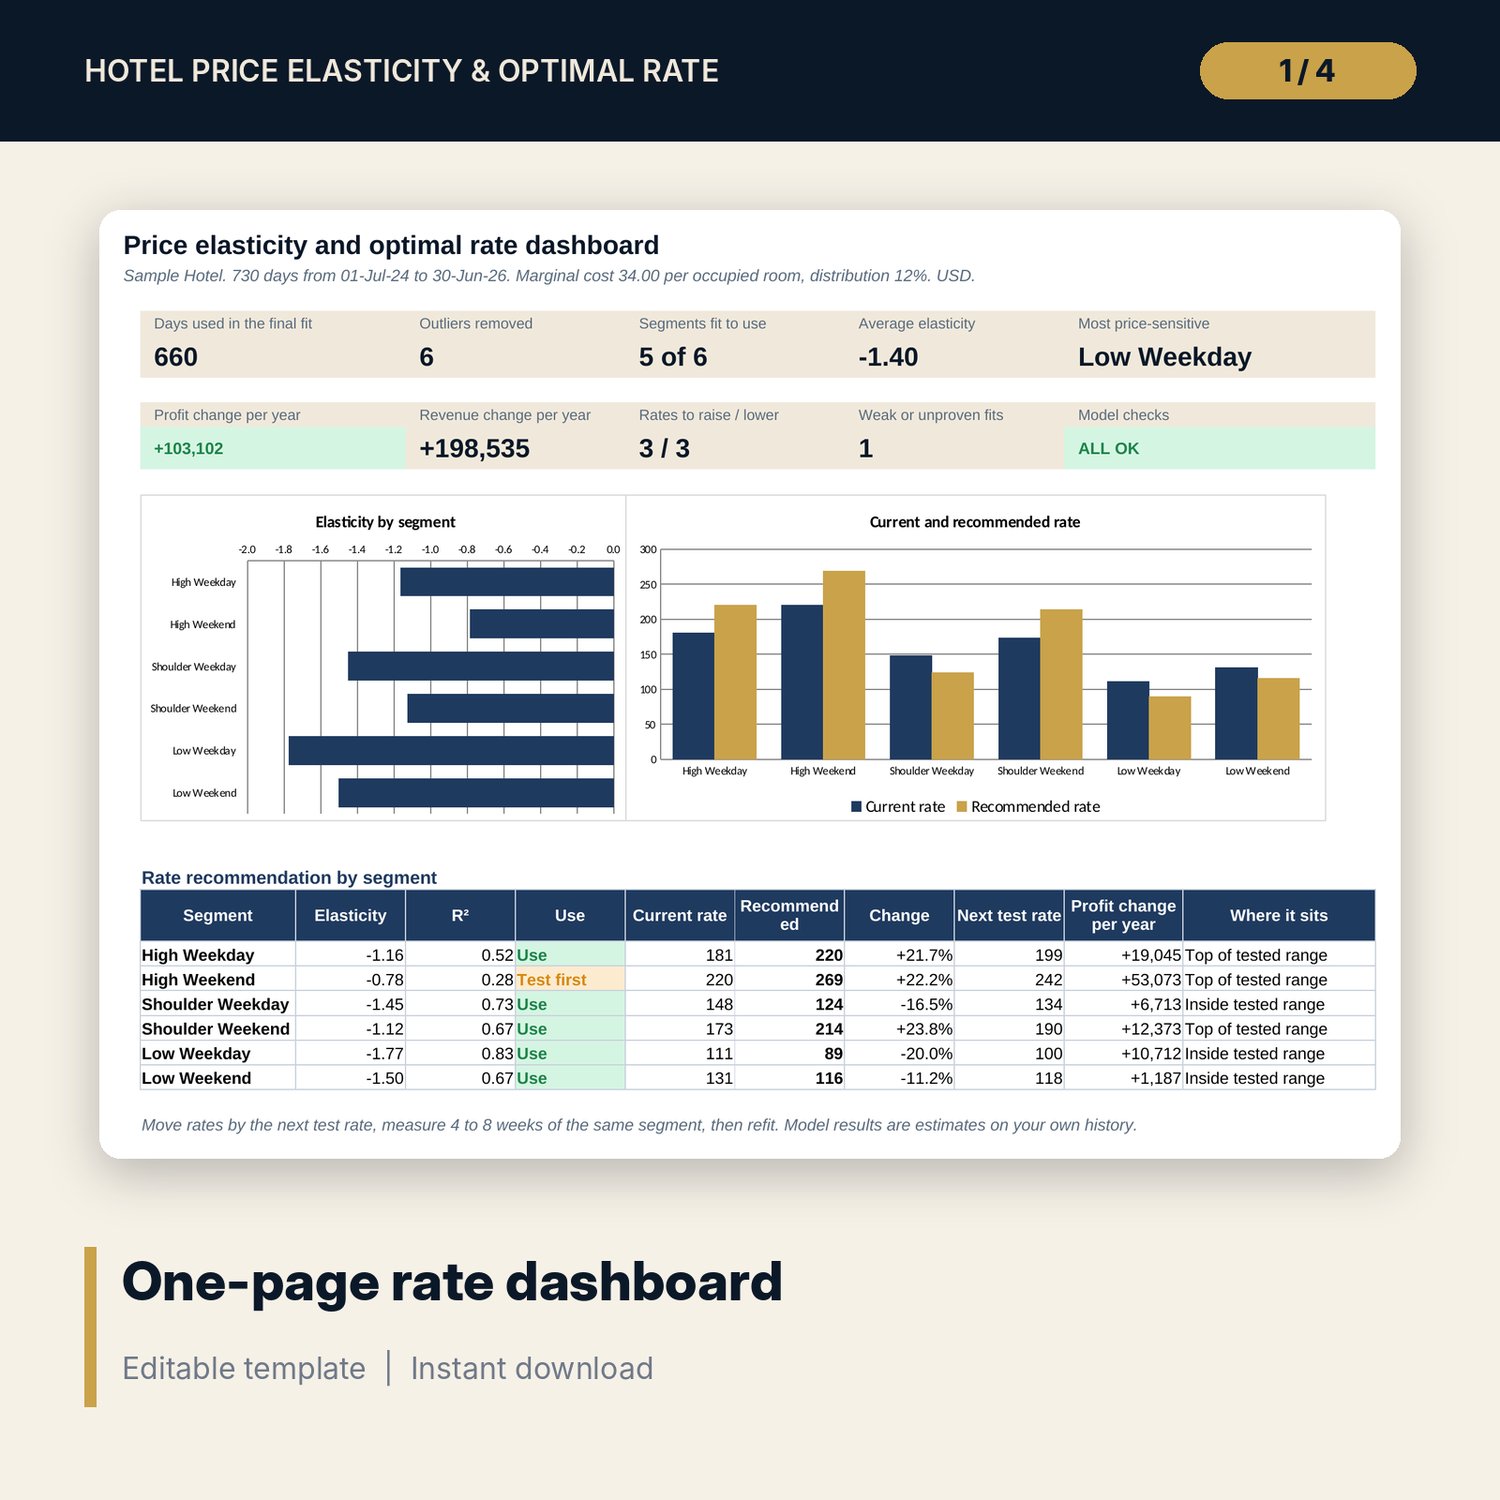
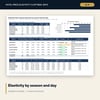
- Elasticity: 6 segments with elasticity, range, R², fit quality, use flag, confidence note and a least-squares audit by hand
- Optimal_Rate: rate that fills capacity, revenue-max, profit-max, recommended and next test rate, and the profit change per year
- Curve_Engine and Price_Curve: 30 price points per segment (180 in all) with demand, revenue and profit curves
- Sensitivity: profit-max rate by elasticity and marginal cost, and profit change by rate move and true elasticity (5 x 5 and 5 x 6 grids)
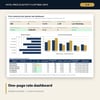
- Dashboard (one printed page), 13 integrity checks and a Method tab with 18 documented calculations
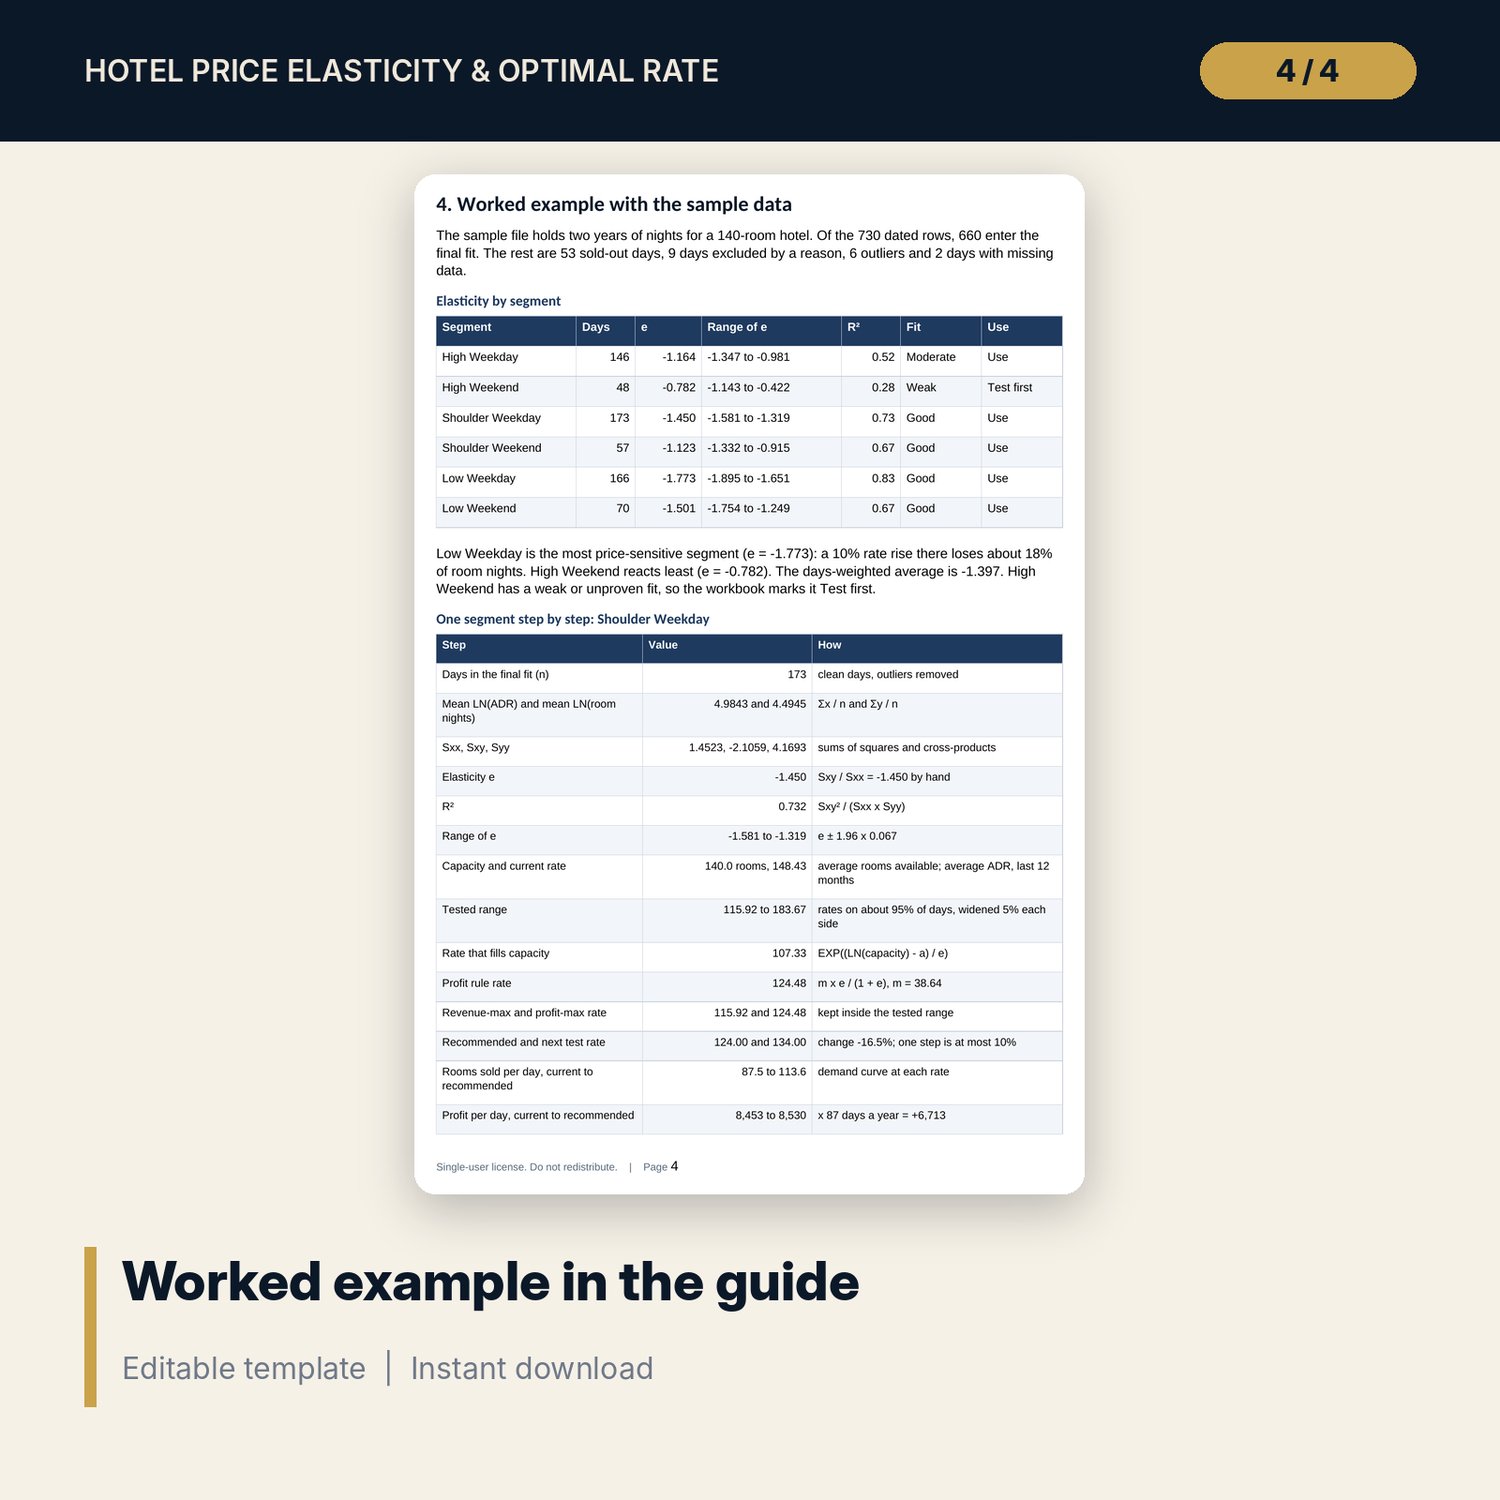
- Hotel_Price_Elasticity_Guide.docx and Hotel_Price_Elasticity_Guide.pdf: 8-page guide with the method in plain equations, a worked example on the sample results, how to act on the results, how to test a price change, limits, common mistakes, a checklist and a glossary
- README.txt and LICENSE-and-Terms.txt
How it works
- Enter marginal cost per occupied room and distribution cost, and set the season map and weekend nights.
- Paste two years of daily rooms available, room nights sold and ADR. Mark events and closures.
- Read the elasticity, its range and the confidence note for each season and day type.
- Read the revenue-max and profit-max rates and the next test rate on Optimal_Rate and the Dashboard.
- Test the move for 4 to 8 weeks, add the new days and refit.
Details
- Formats: XLSX workbook, DOCX guide, PDF guide
- Language: English
- Software: Excel 2016 or later, or LibreOffice Calc 7 or later
- No macros, no data tables, no array formulas, no external links
- Instant digital download
Good to know
- Sample data is illustrative. Replace it with your own figures.
- Elasticity measured from history is an estimate. Rates that followed demand, sold-out days and competitor moves can bias it; the guide explains each one.
- Not financial advice. Commissions, taxes and fees are inputs: verify local requirements.
- Single-user license. Do not redistribute.
FAQ
What data do I need?
One row per night with rooms available, room nights sold and ADR for the demand you price with the daily rate. Two years gives each segment enough days.
What if my R² is low?
The segment is marked Weak and Test first, and the confidence note tells you to read the elasticity as a range and move the rate in small steps.
Why are revenue-max and profit-max rates different?
Each extra room costs housekeeping, laundry, amenities, energy and commission. The profit-max rate stops filling rooms when the lower rate no longer covers that cost.
Will it tell me to charge rates I have never charged?
No. Rates stay inside the range your data covers, widened by a small extension you set, and the next test rate moves at most one step.
Does it need macros or add-ins?
No. Every result, including the regressions, the 30-point curves and the grids, is a standard worksheet formula.