
Hotel Portfolio Consolidation & Ranking Dashboard: Multi-Hotel Consolidation Excel with KPI Ranking and Variance Analysis
Full description
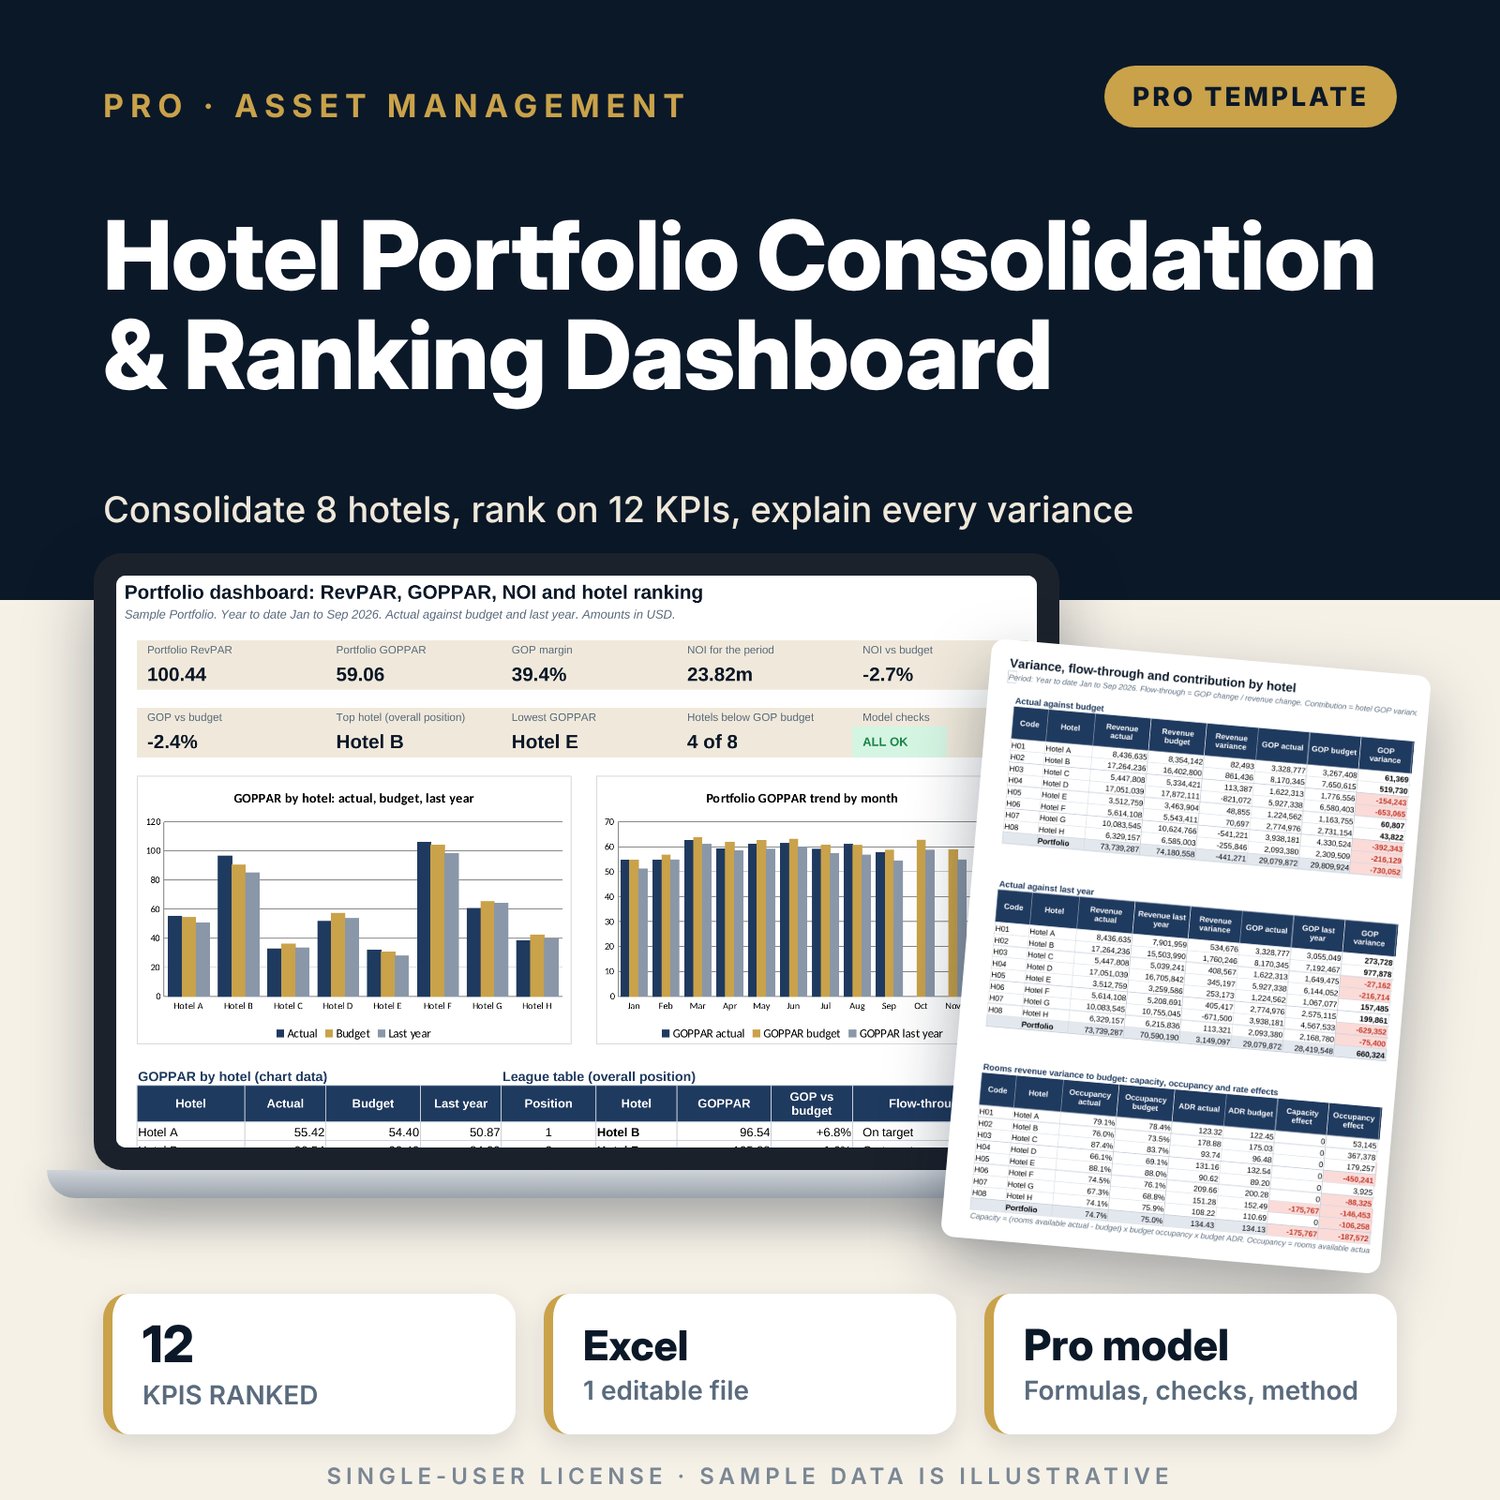
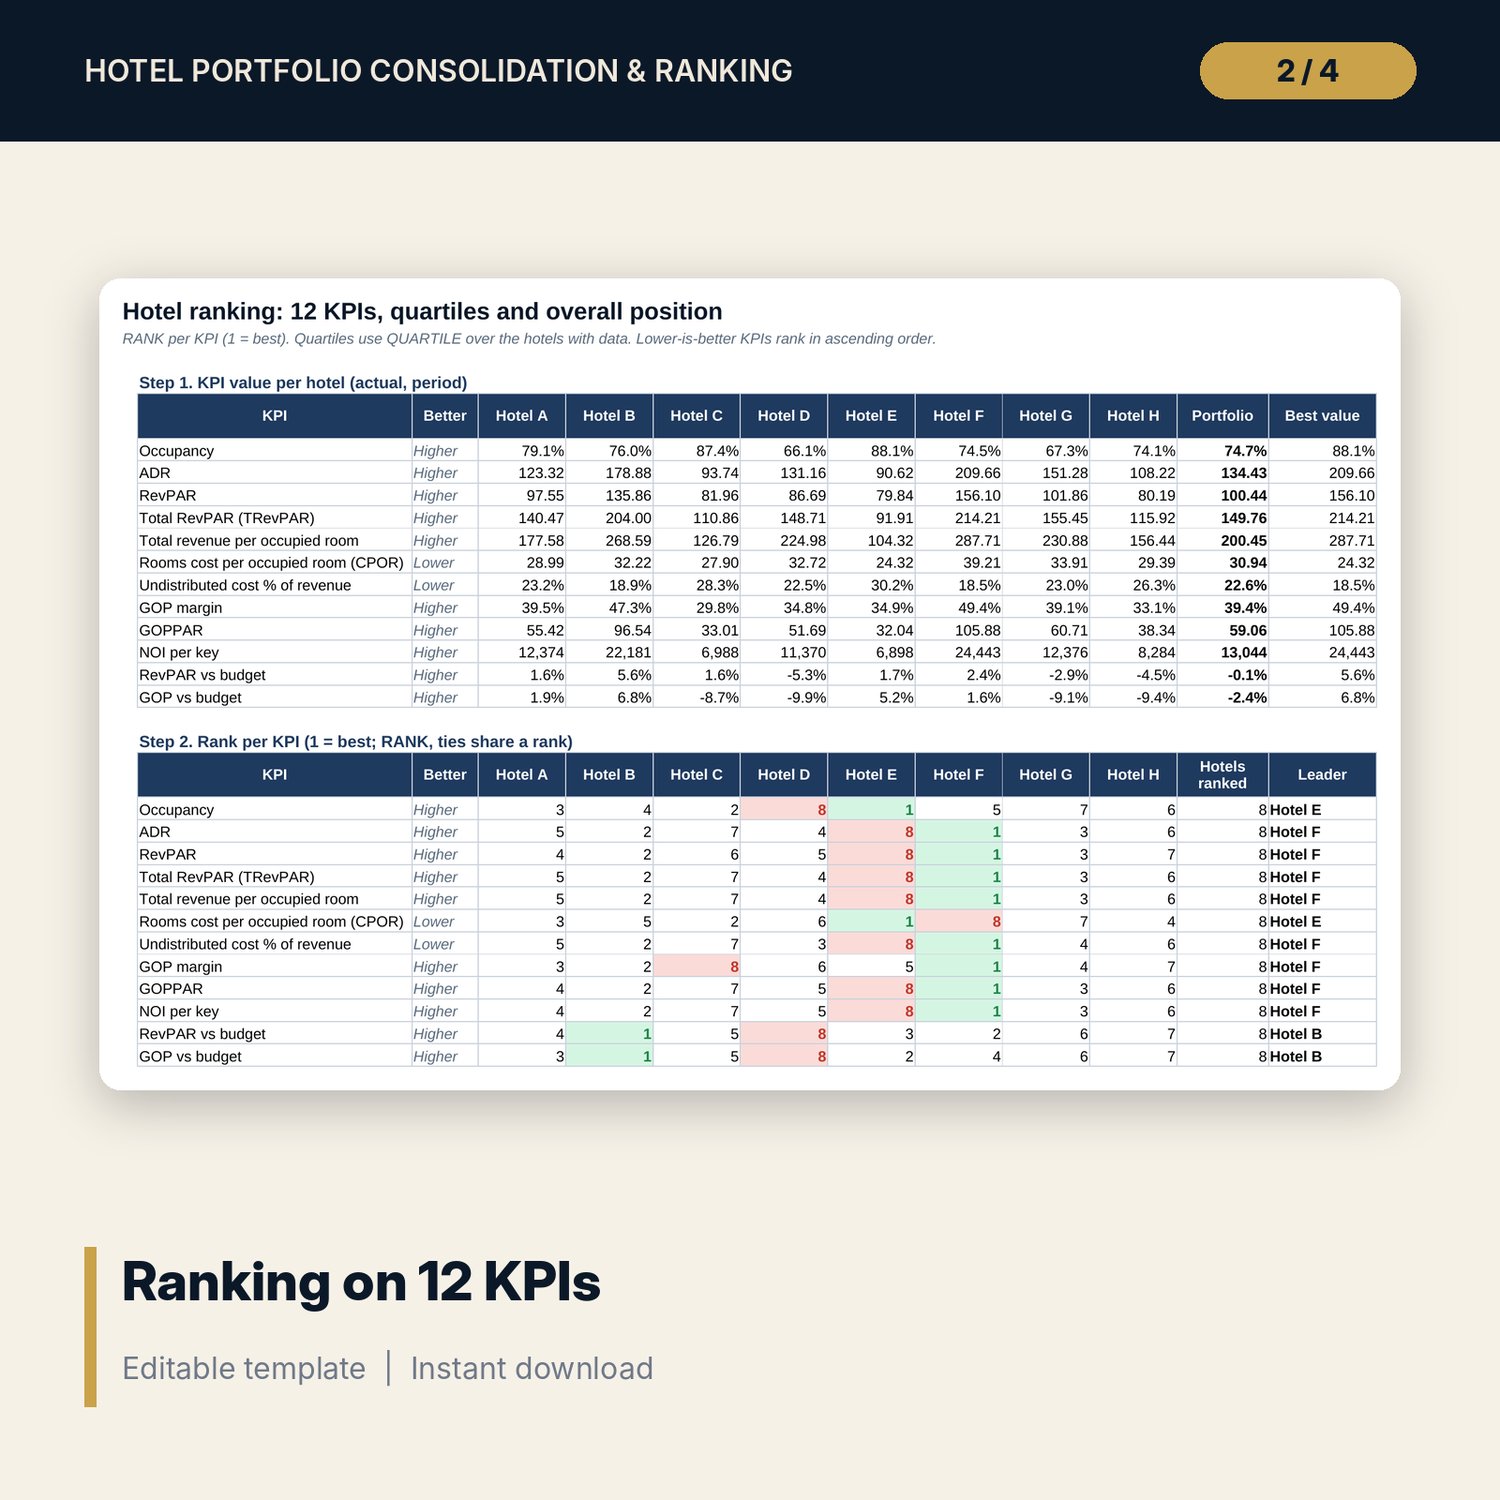
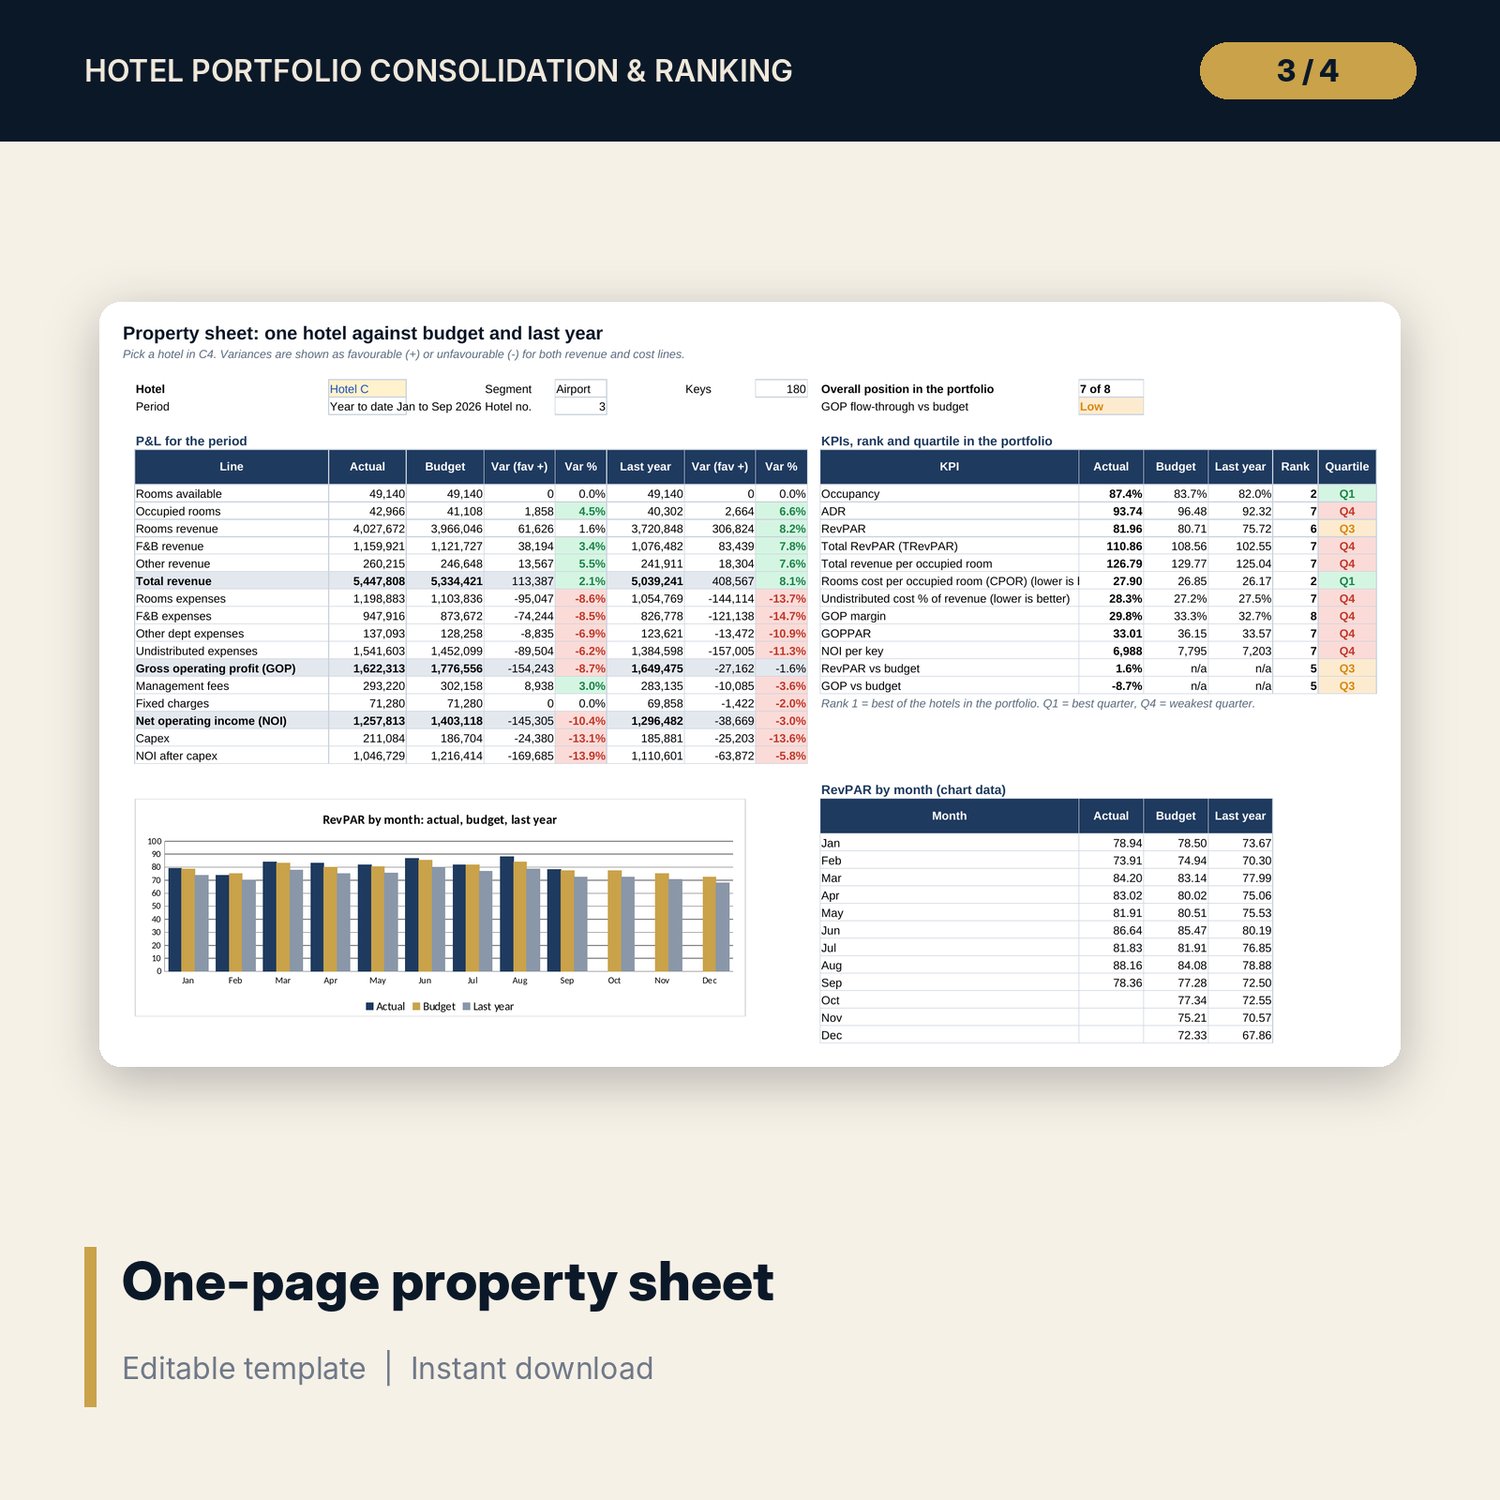
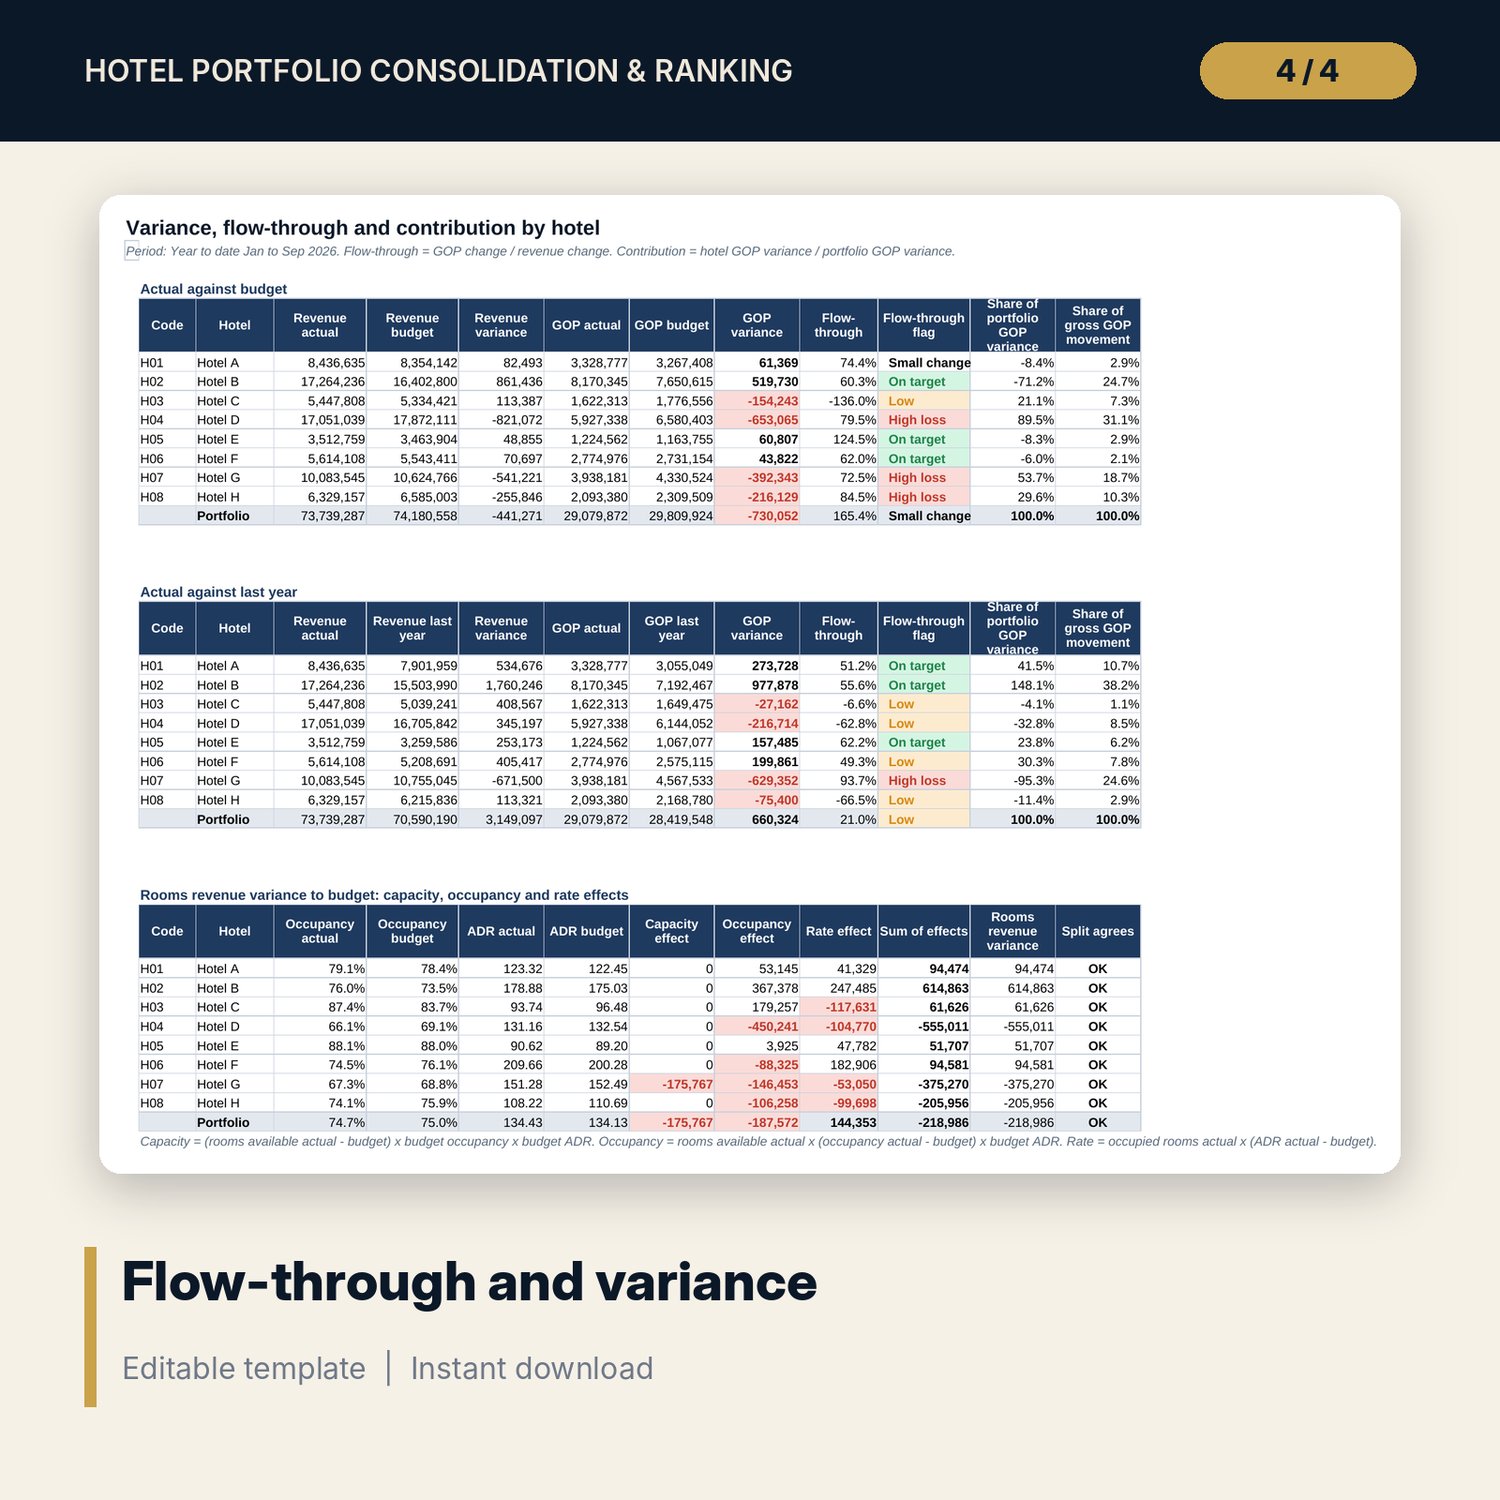
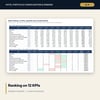
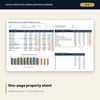
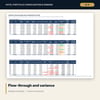
For asset managers, regional general managers and financial controllers who report on several hotels each month. Paste monthly results per hotel for actual, budget and last year into one data table; the workbook consolidates them with SUMIFS for the month or year to date, builds occupancy, ADR, RevPAR, TRevPAR, CPOR, GOP margin, GOPPAR, NOI per key and capex per key, and measures flow-through and each hotel's share of the portfolio GOP variance. Rooms revenue variance is split into capacity, occupancy and rate effects that add up exactly. Every hotel is ranked on 12 KPIs with RANK, flagged by quartile and given an overall position, and a property selector prints a one-page sheet per hotel.
Save with a bundle: this workbook is also in the Hotel Finance & Investment Pro Bundle, 25 workbooks for $59 instead of $329. All 100 Pro workbooks are in the Pro Library for $119, and all 241 templates and workbooks are in the Ultimate Hospitality Library for $149.
What is inside
- Hotel_Portfolio_Consolidation_Ranking.xlsx: 12 tabs, 4,293 formulas, 4 native charts, 11 drop-down and input rules
- Data tab with 288 keyed rows (8 hotels x 3 versions x 12 months; sample actuals for 9 months) and 24 spare rows, each with a row test
- Consolidation: 17 columns per hotel (keys, volumes and P&L lines down to NOI after capex) for actual, budget and last year, with portfolio totals
- KPIs: 13 ratios per hotel and version plus 7 variance measures
- Variance: flow-through with flags, contribution to the portfolio GOP variance, rooms revenue split into 3 effects
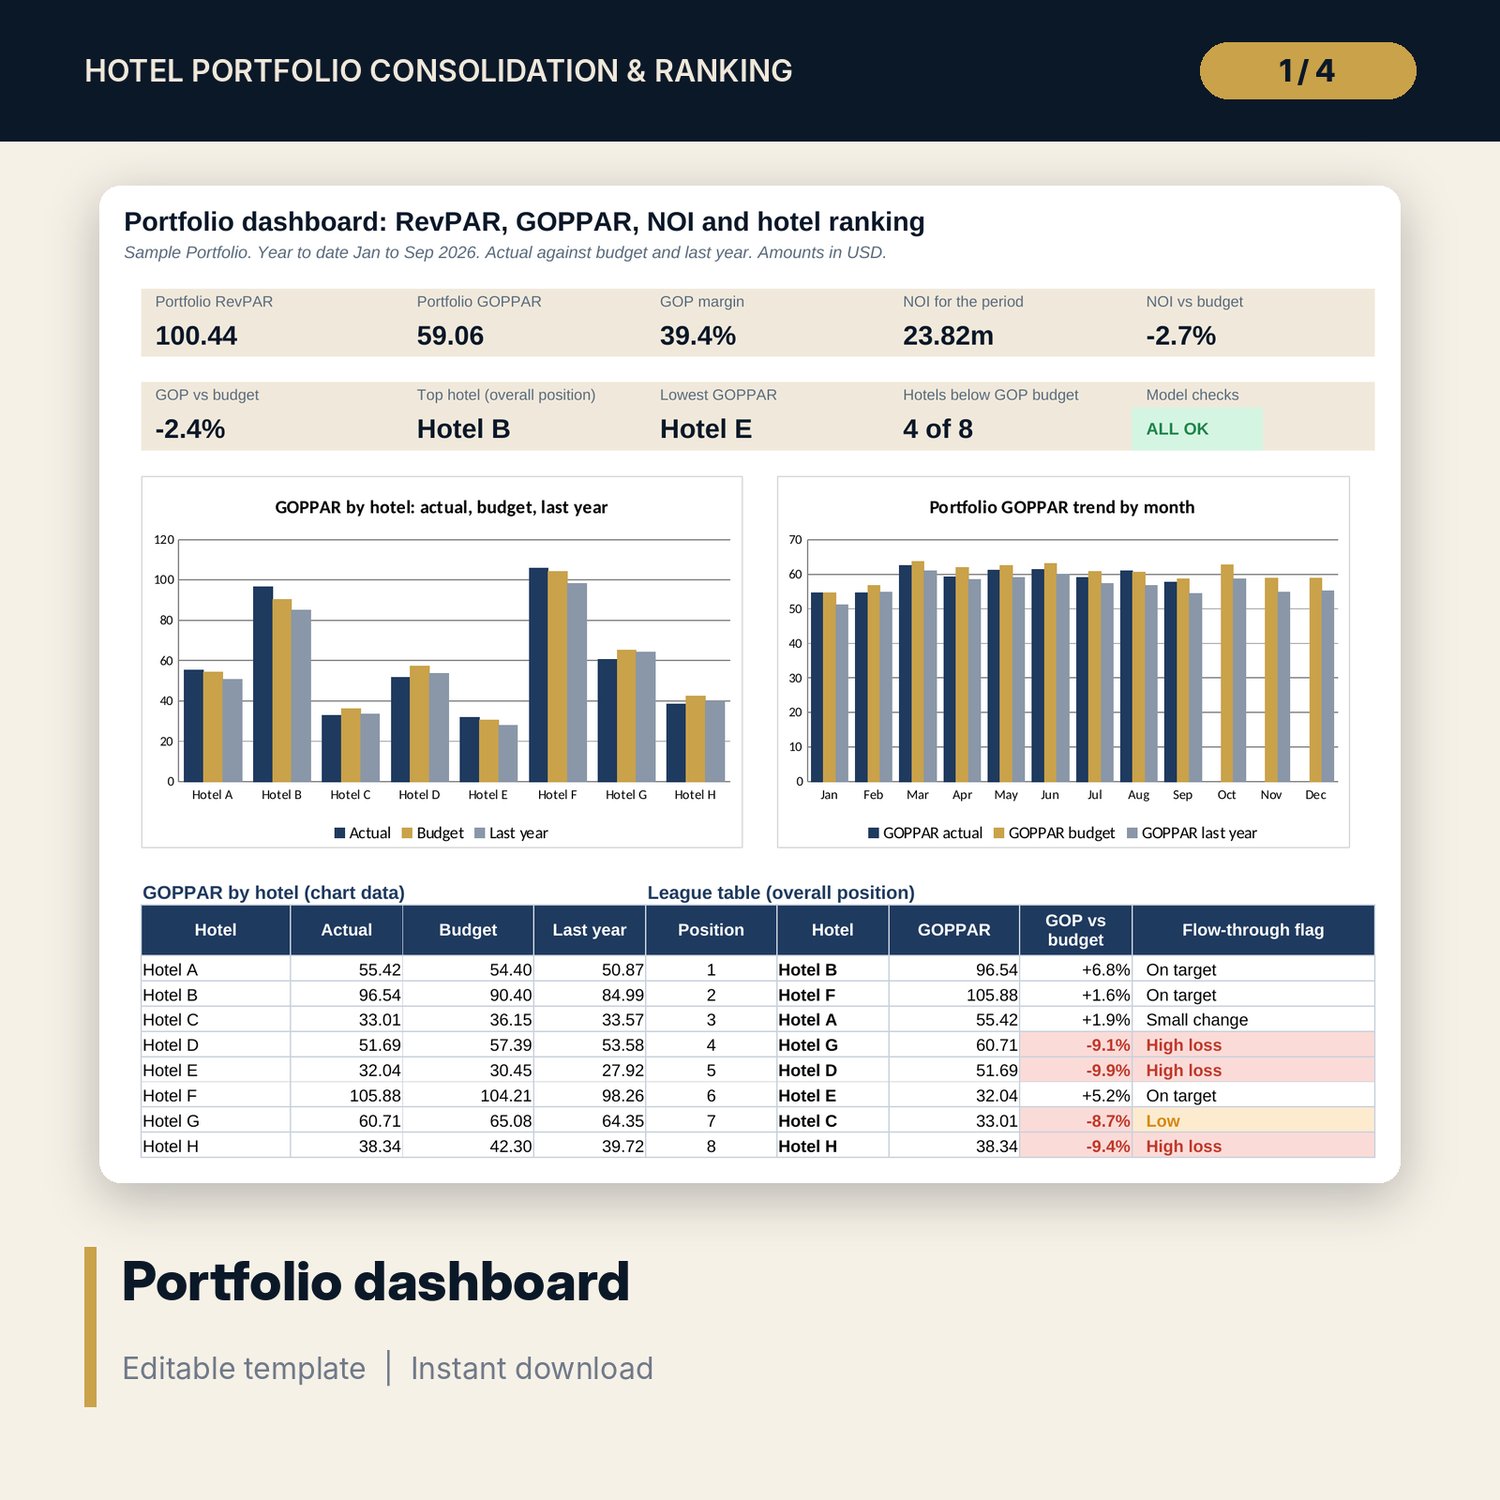
- Ranking: 12 KPIs ranked, quartile flags, average rank and overall position
- Property: one-page sheet per hotel with KPI ranks and a RevPAR chart
- Dashboard (one printed page) with 9 KPI tiles, a check tile, 2 charts and the league table
- 13 integrity checks and a Method tab with 17 documented calculations
- README.txt and LICENSE-and-Terms.txt
How it works
- Enter the hotel list, reporting month and month or year-to-date basis on Settings.
- Paste monthly results for actual, budget and last year into Data, one row per hotel, version and month.
- Read Consolidation, KPIs and Variance to see what moved and where the GOP variance came from.
- Read Ranking and Dashboard for the league table, then print the Property sheet for each hotel.
- Confirm that Checks shows ALL OK before you send the pack.
Details
- Format: one .xlsx workbook, English
- Software: Excel 2016 or later, or LibreOffice Calc 7 or later
- No macros, no external links, no pivot tables, no array formulas
- Instant digital download
Good to know
- Sample data is illustrative. Replace it with your own figures.
- A reporting tool, not financial or investment advice. Line definitions follow your own chart of accounts; verify local requirements.
- Per-key results cover the selected period and are not annualised.
- Single-user license. Do not redistribute.
FAQ
Can I report fewer than 8 hotels?
Yes. Leave a hotel slot blank or set In portfolio to No. Totals, ranks and quartiles use only the hotels in the portfolio.
Does it handle month and year to date?
Yes. Pick the reporting month and the basis on Settings; every tab follows.
How is the ranking built?
Each of the 12 KPIs is ranked with RANK, ascending for cost KPIs. The overall position is the average rank, with ties broken by hotel order.
What does flow-through tell me?
The share of a revenue change that reached GOP. The workbook flags low flow-through on revenue gains and high GOP loss on revenue declines.
Does it need macros or add-ins?
No. Every result is a standard worksheet formula.