Hotel Financial Ratio & Benchmark Analysis Toolkit: Hotel Financial Ratio Analysis Excel with Benchmark Bands and Red Flags
Full description
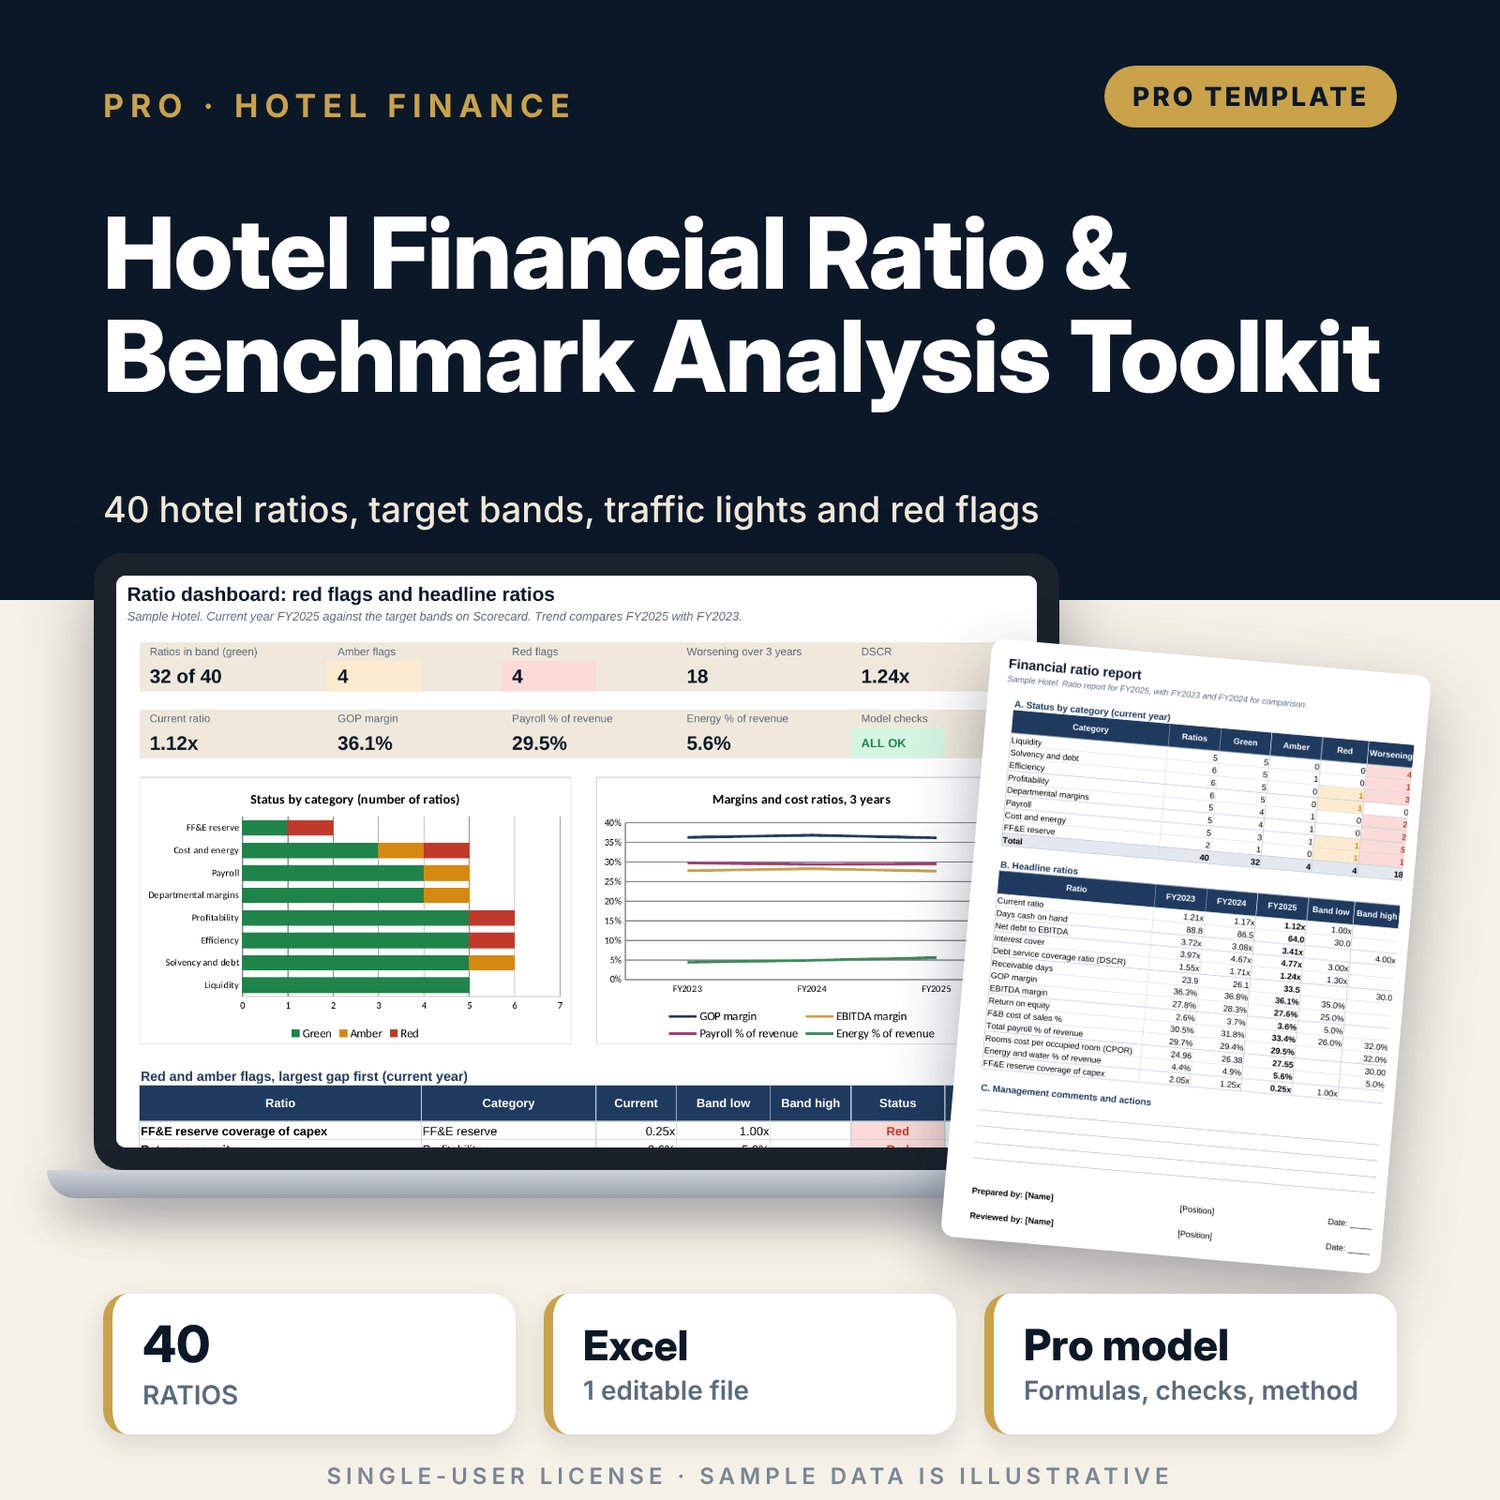
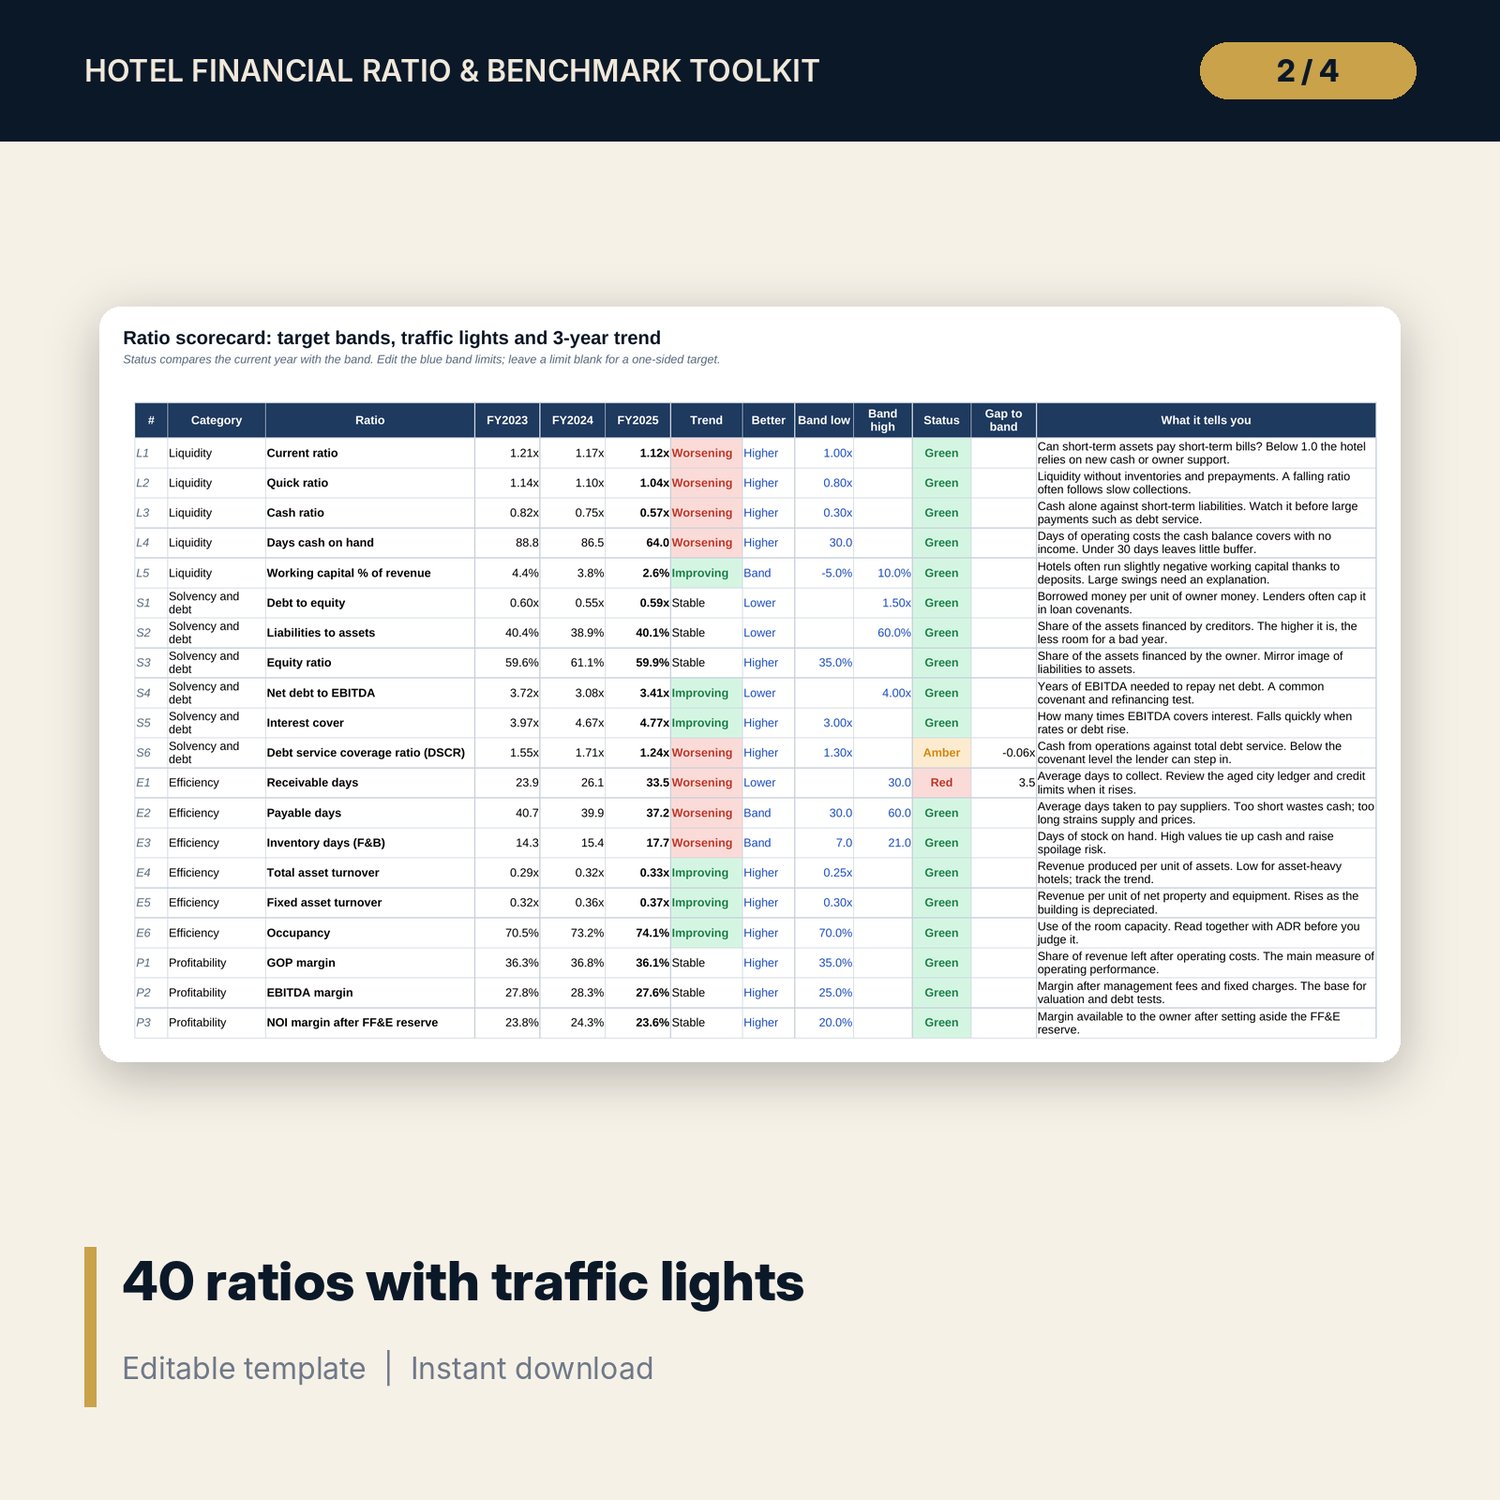
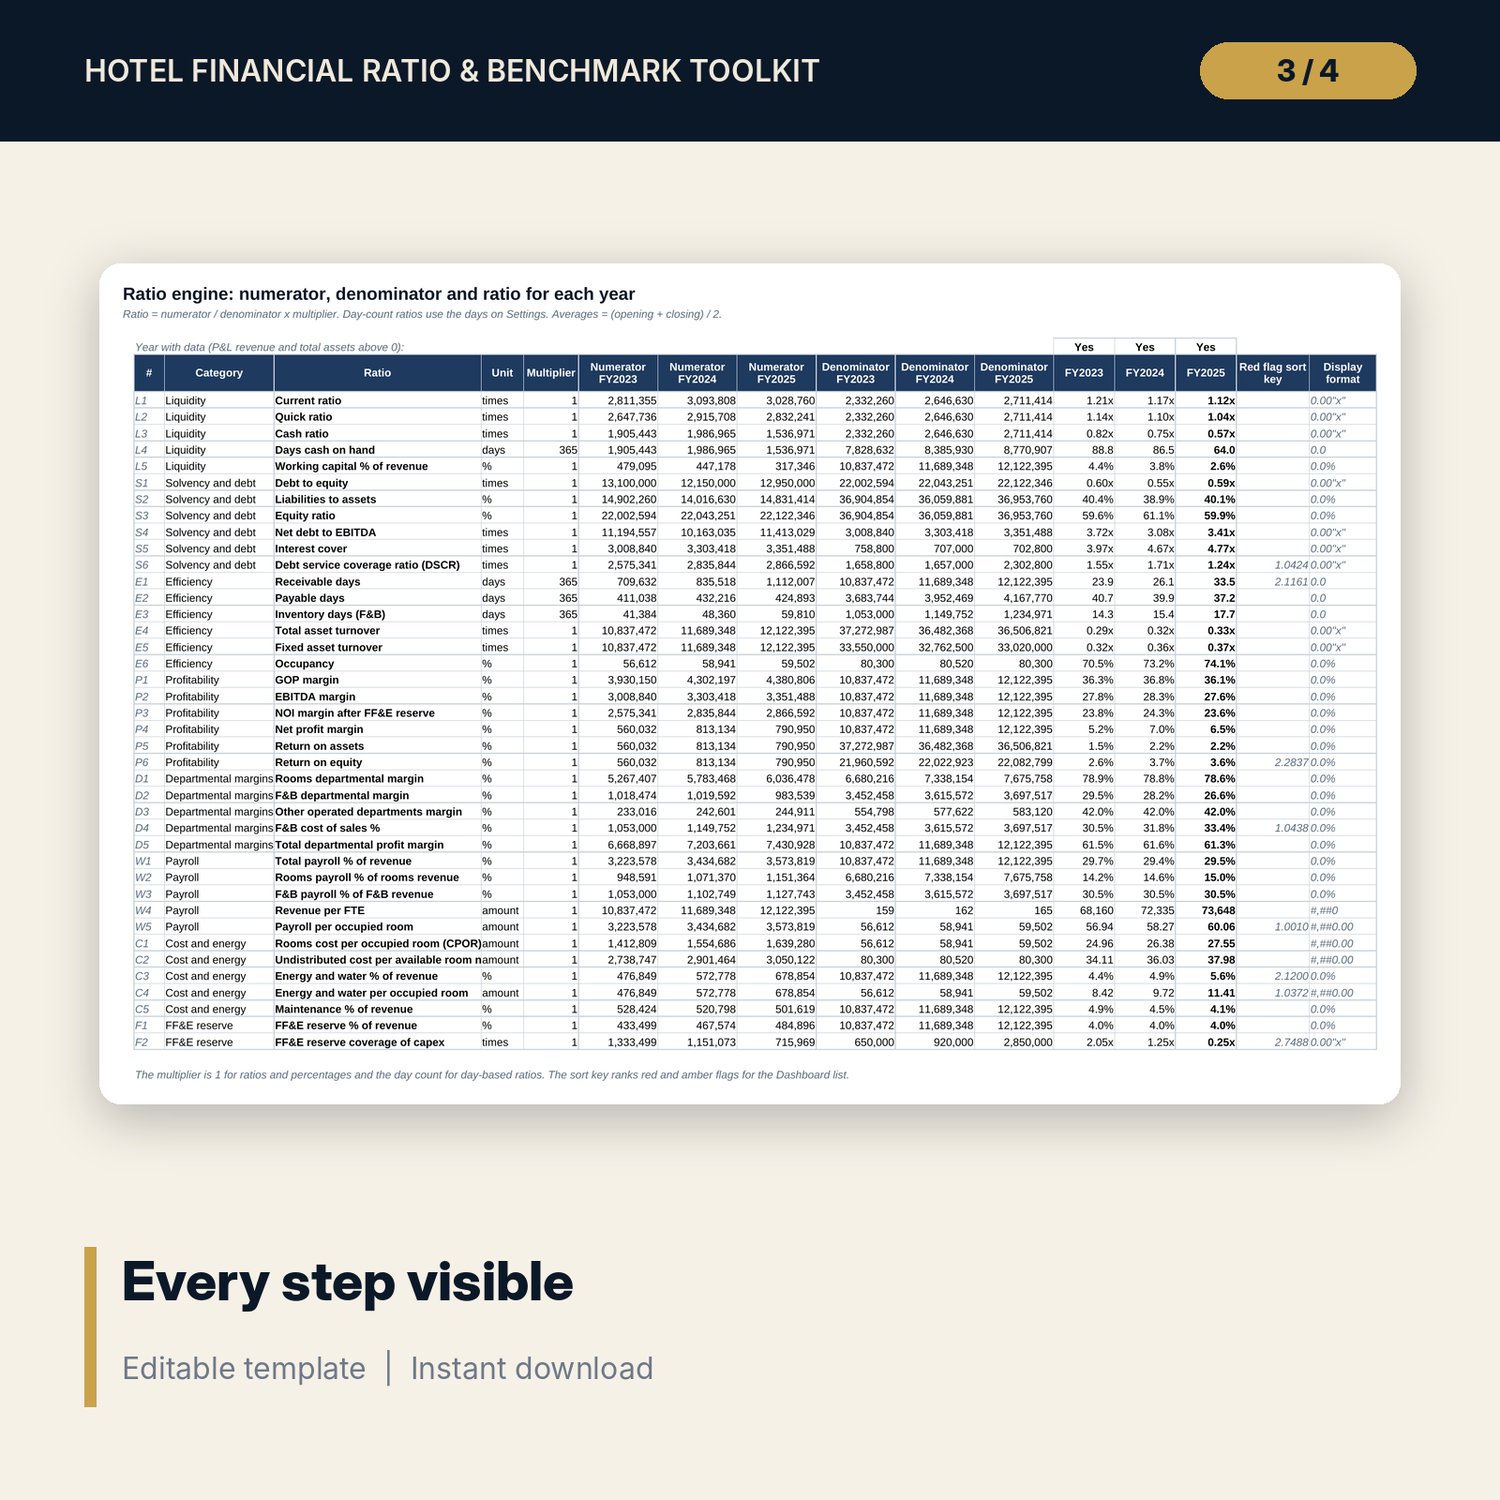
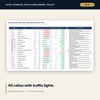
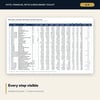
For financial controllers, general managers, owners' representatives and auditors who review a hotel's health once a month or once a year. Enter a summary P&L for three years and the balance sheet at four year-ends; the workbook computes 40 ratios across liquidity, solvency and debt, efficiency, profitability, departmental margins, payroll, cost per occupied room and energy, and FF&E reserve. Each ratio shows its numerator, denominator and multiplier per year, so every figure can be traced. You set a target band per ratio from your budget, owner targets or peer set; the Scorecard gives a Green, Amber or Red status, a direction-aware 3-year trend and a plain explanation of what the ratio tells you. Roll-forward checks reconcile retained earnings, fixed assets and debt between the two statements.
Save with a bundle: this workbook is also in the Hotel Finance & Investment Pro Bundle, 25 workbooks for $59 instead of $329. All 100 Pro workbooks are in the Pro Library for $119, and all 241 templates and workbooks are in the Ultimate Hospitality Library for $149.
What is inside
- Hotel_Financial_Ratio_Benchmark_Toolkit.xlsx: 10 tabs, 1,198 formulas, 2 native charts, 6 drop-down and input rules
- PL_Input: 45 lines for 3 years, including payroll by department, EBITDA, NOI after FF&E reserve and cash flow items
- BS_Input: 26 lines at 4 year-ends with a balance check
- Ratio_Engine: 40 ratios x 3 years with numerator, denominator and multiplier in separate columns
- Scorecard: editable band per ratio, traffic-light status, gap to band, 3-year trend and an explanation column
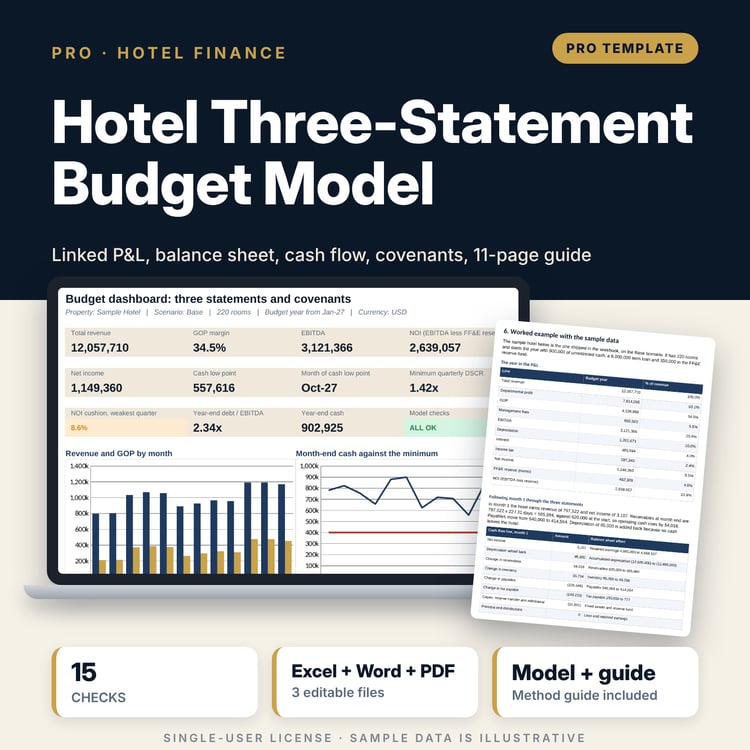
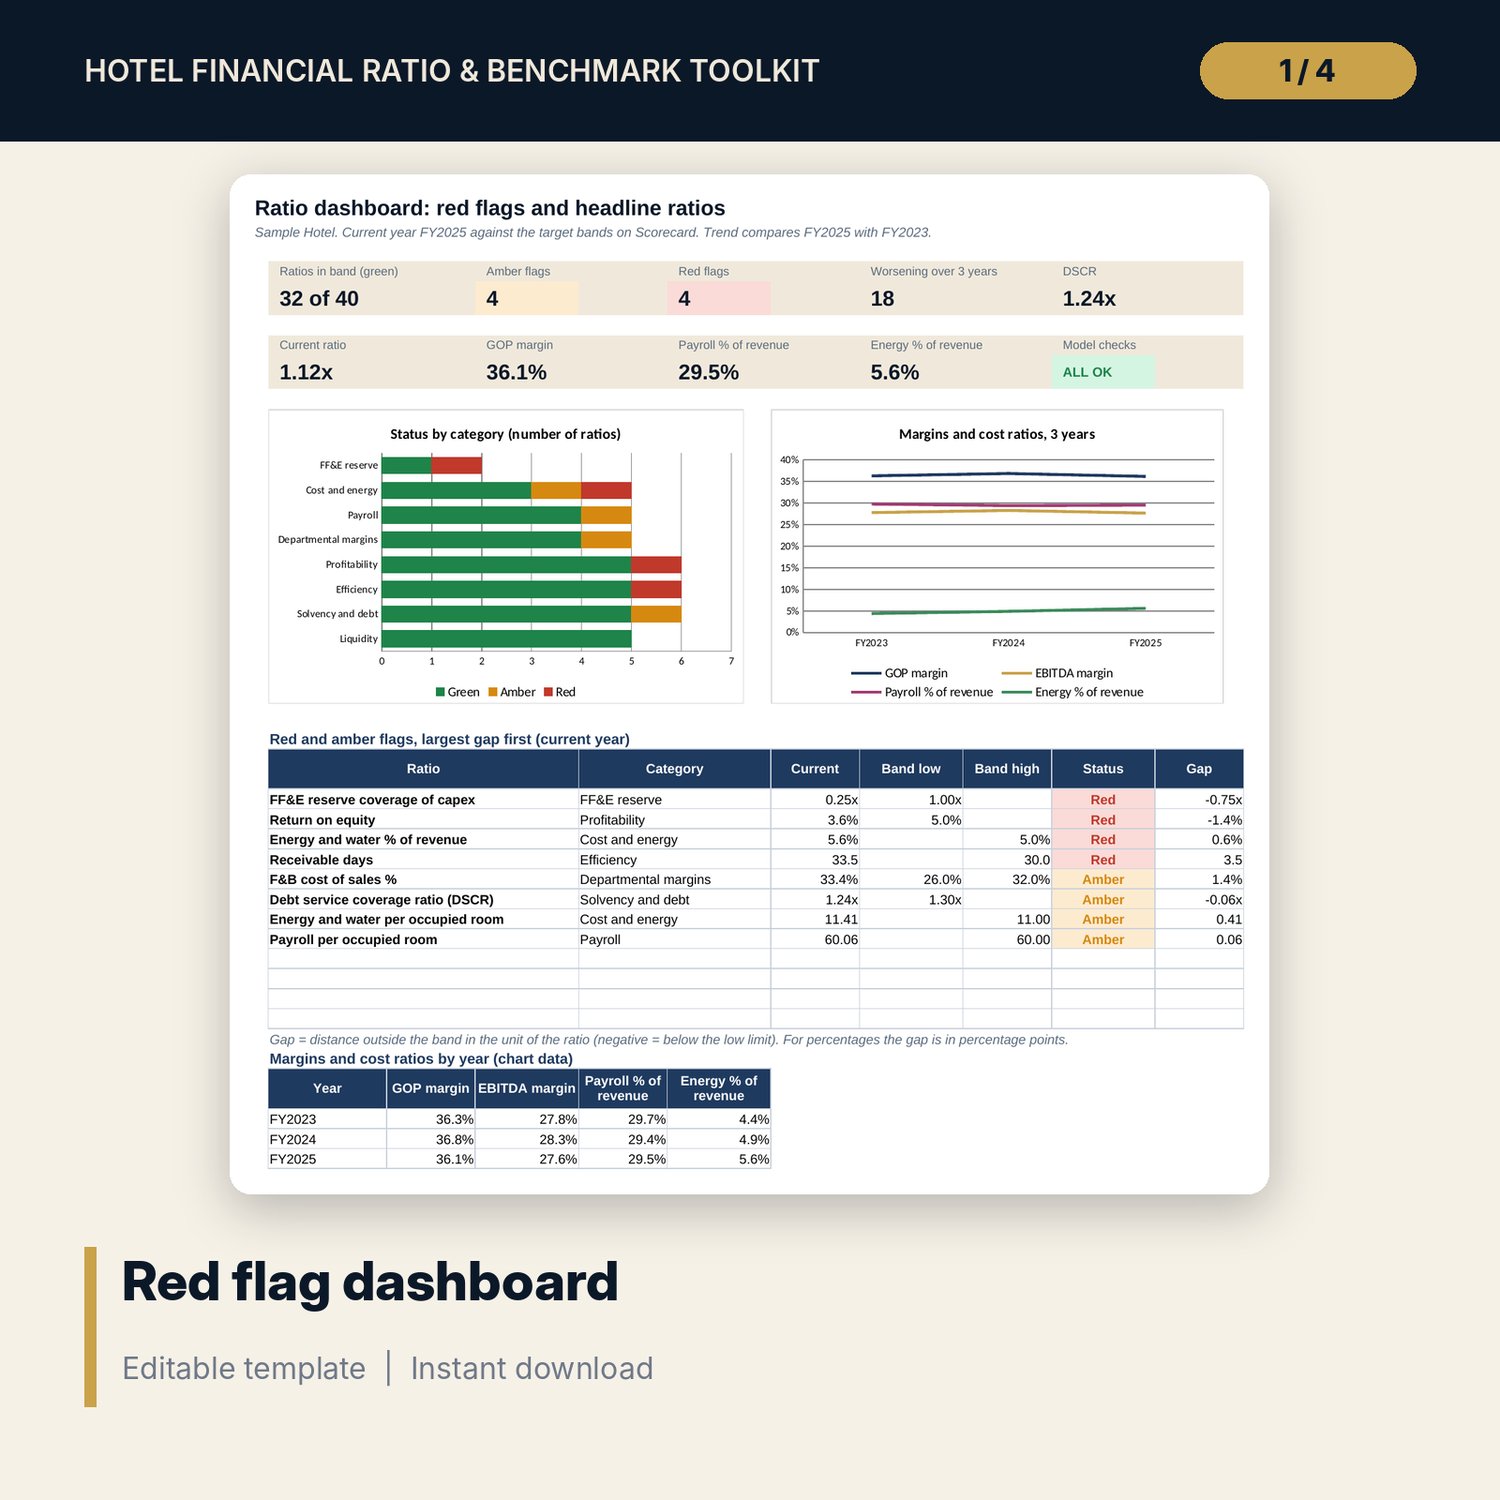
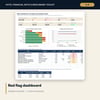
- Dashboard (one printed page): 9 KPI tiles, a check tile, the 12 largest red and amber flags and 2 charts
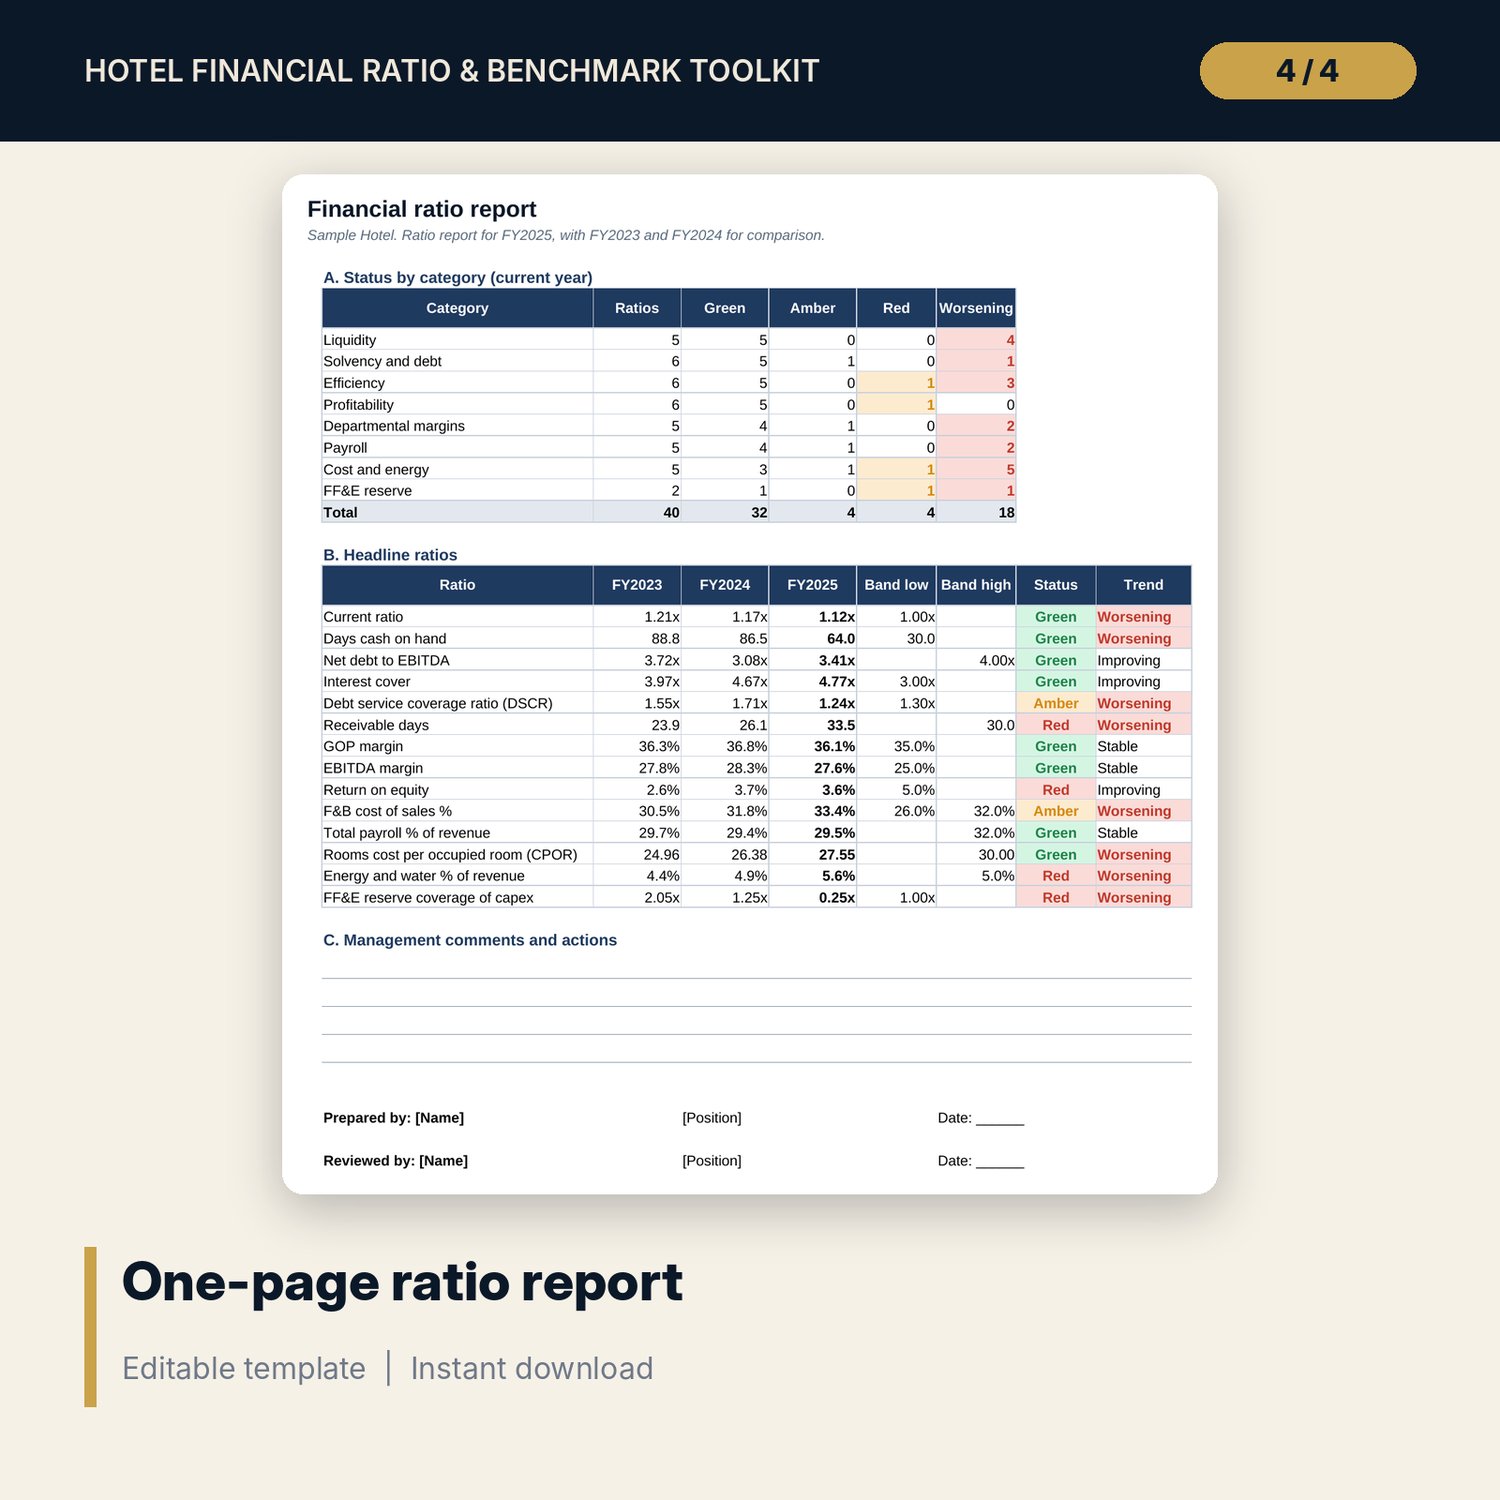
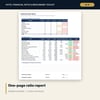
- Report: one printable page with status by category, 14 headline ratios, comment lines and sign-off
- 14 integrity checks and a Method tab with 14 documented calculations
- README.txt and LICENSE-and-Terms.txt
How it works
- Enter the hotel label and year labels on Settings.
- Fill PL_Input for three years and BS_Input for four year-ends from your accounting system.
- Set the target band for each ratio on Scorecard.
- Read the red flags on Dashboard and the explanation for each ratio on Scorecard.
- Print Report for the owner or the monthly review, after Checks shows ALL OK.
Details
- Format: one .xlsx workbook, English
- Software: Excel 2016 or later, or LibreOffice Calc 7 or later
- No macros, no external links, no array formulas
- Instant digital download
Good to know
- Sample data and target bands are illustrative. Set bands from your own budget, owner targets or peer data.
- An analysis tool, not financial, tax or lending advice. Loan covenant definitions vary; verify them with your lender and verify local requirements.
- Ratios follow summary lines. Map your chart of accounts to these lines once and keep the mapping the same each year.
- Single-user license. Do not redistribute.
FAQ
Which ratios are included?
40 ratios in 8 groups: liquidity, solvency and debt (including DSCR), efficiency, profitability, departmental margins, payroll, cost and energy, and FF&E reserve.
Can I change the target bands?
Yes. Each ratio has a blue low and high limit. Leave one blank for a one-sided target. The amber tolerance sits on Settings.
What if I only have two years of data?
Leave the oldest year blank. Ratios for that year show blank, and the trend shows blank until three years are entered.
How is the trend judged?
It compares the current year with the oldest year and respects the direction of each ratio, so a falling cost ratio shows Improving.
Does it need macros or add-ins?
No. Every result is a standard worksheet formula.