Glamping Site Business Plan & Financial Model: Glamping Business Plan Spreadsheet with 5-Year Projection
Full description
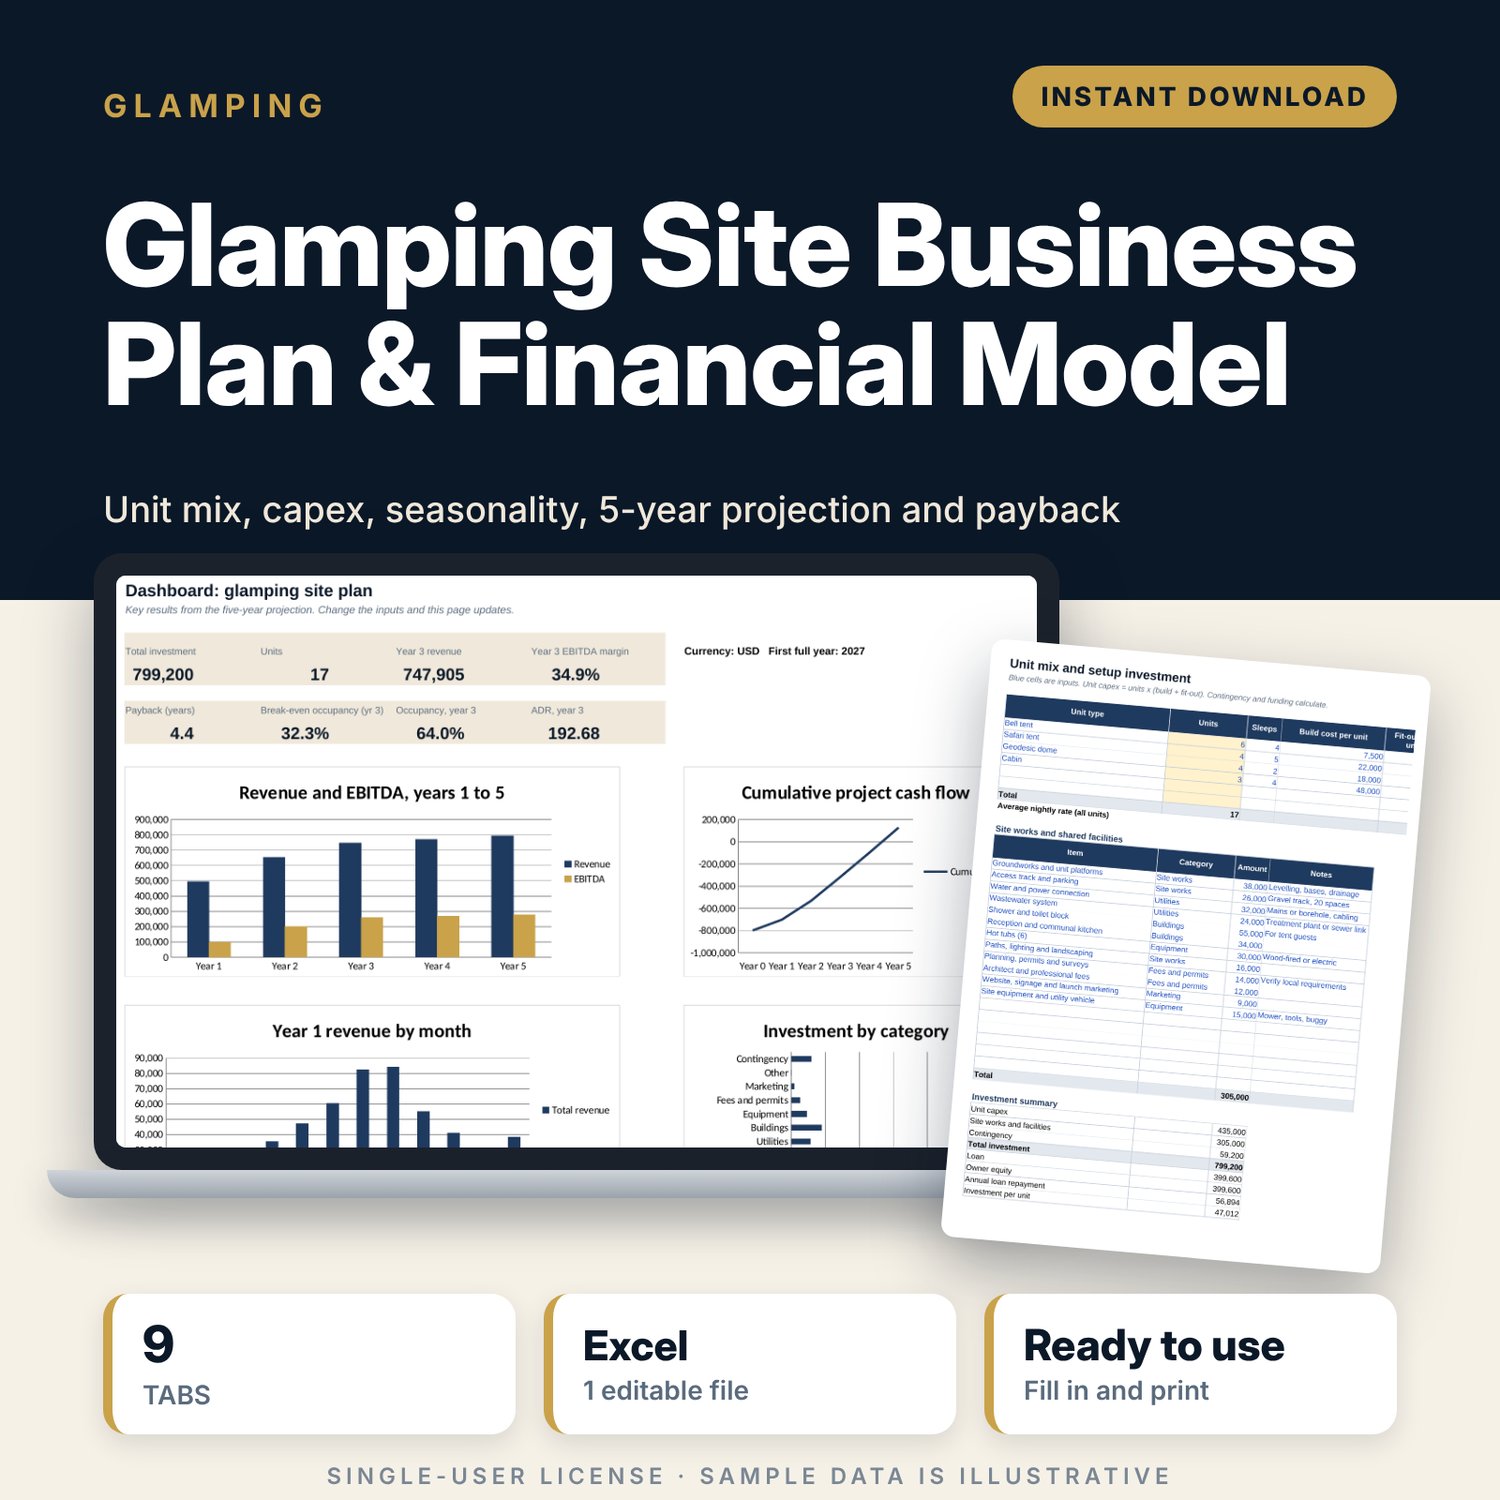
For landowners, farm diversifiers and first-time operators who want to know whether a glamping site will pay back before they build it. You set the unit mix with build cost and nightly rate, the months you open, expected occupancy, staff and running costs. The model builds year 1 month by month, projects five years of profit and cash flow with an optional loan, and shows the payback year, break-even occupancy and break-even nightly rate. Two sensitivity grids show what happens if prices or occupancy come in lower or higher.
Save with a bundle: this template is also in the Alternative Lodging Bundle, 10 templates for $29 instead of $74. All 141 templates are in the All-Access Hospitality Template Library for $79.
What is inside
- Glamping_Site_Business_Plan_Model.xlsx: 9 tabs, 640 formulas, 6 native charts, 9 drop-down or number rules.
- Settings: 4 general inputs, 8 guest spend and variable cost inputs, a 5-year occupancy ramp-up, and 7 investment, tax and loan inputs.
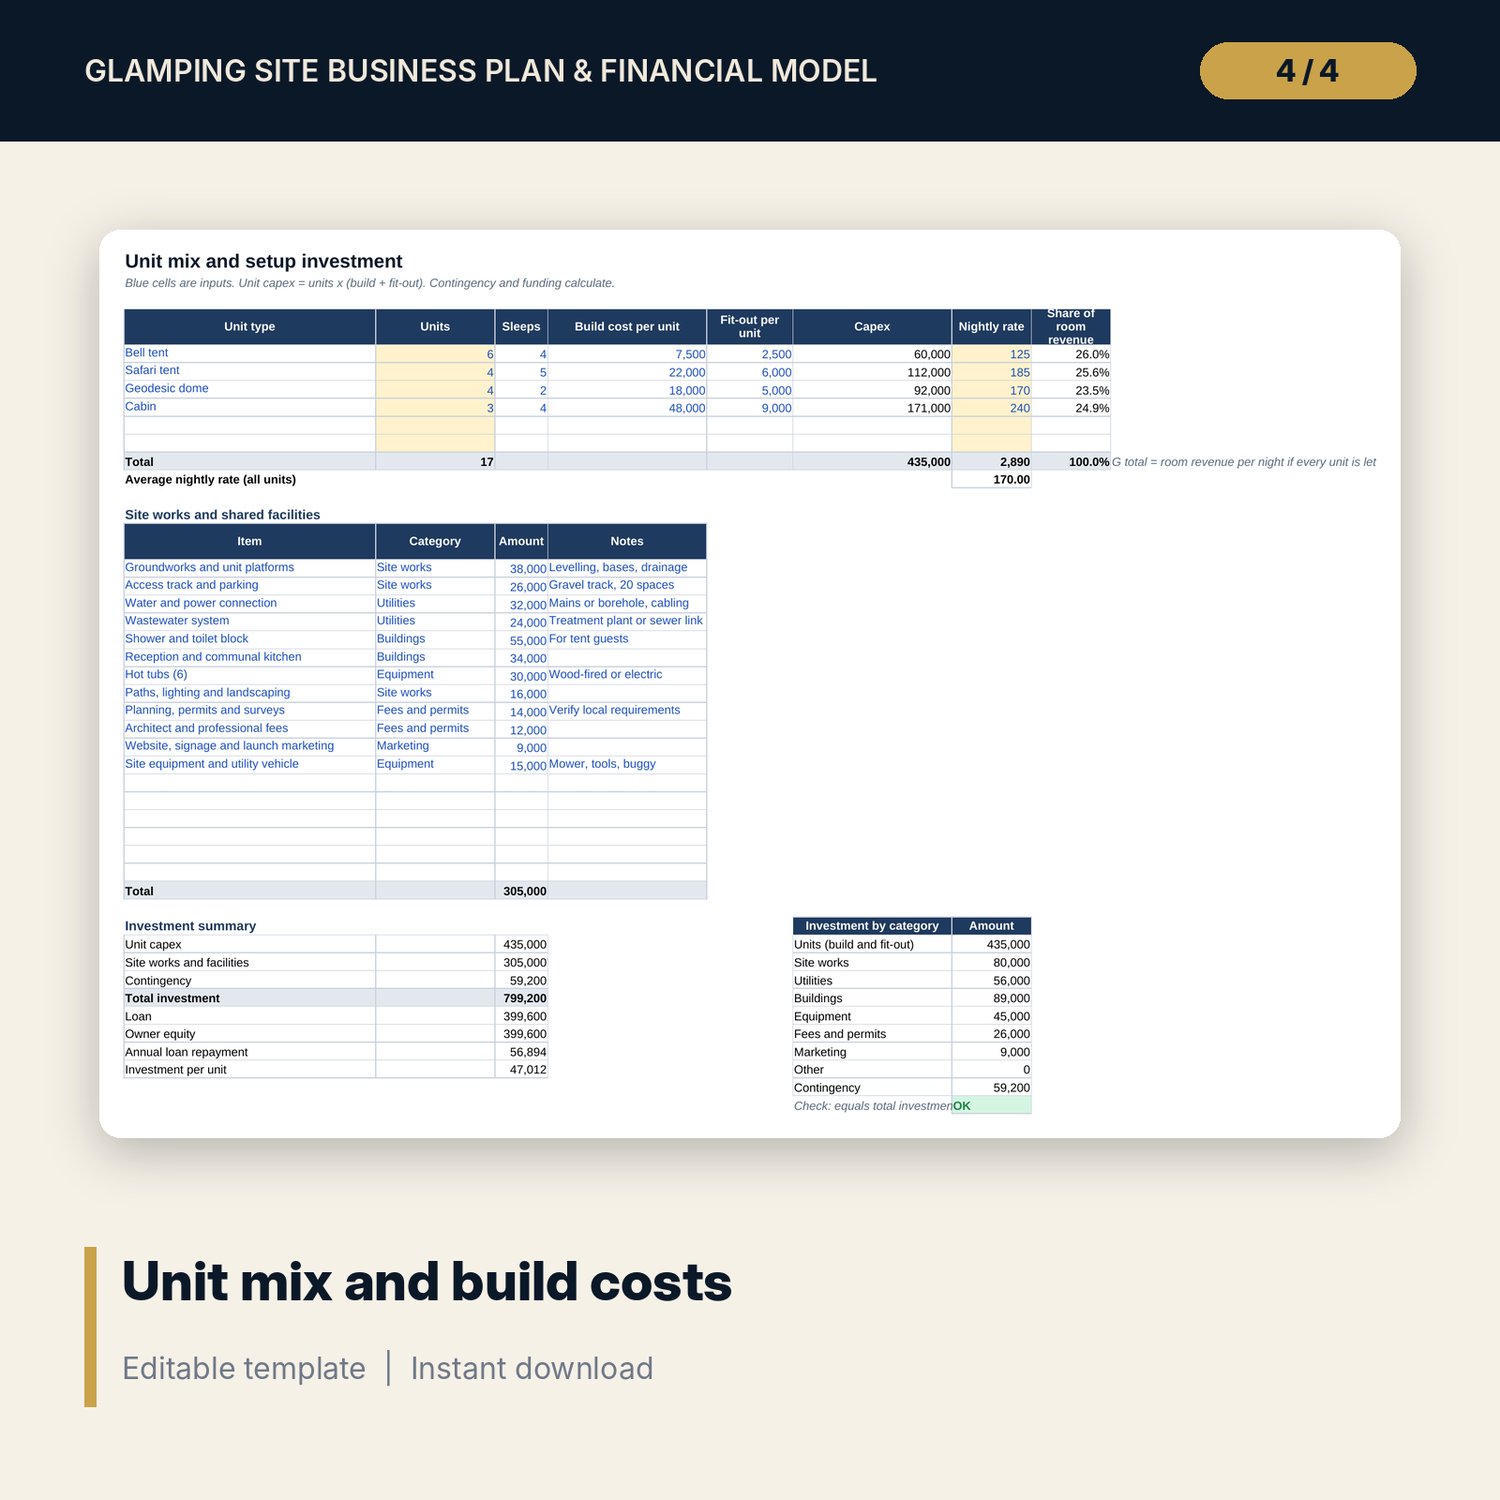
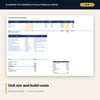
- Units_Capex: 6 unit-type rows (4 sample: bell tent, safari tent, geodesic dome, cabin) with units, sleeps, build cost, fit-out, nightly rate and revenue share; 18 site-works rows (12 sample) in 7 categories; investment summary with contingency, loan, equity and annual repayment.
- Seasonality: days open, occupancy and rate index for 12 months, weighted year totals and a chart.
- Operating_Costs: 8 staff role rows (5 sample) with FTE, pay and months worked, employer on-costs, 16 fixed cost rows (12 sample) and variable cost per occupied unit-night.
- Monthly_Year1: 12 months of nights, revenue, costs, EBITDA and cumulative EBITDA, the cash low point and a chart.
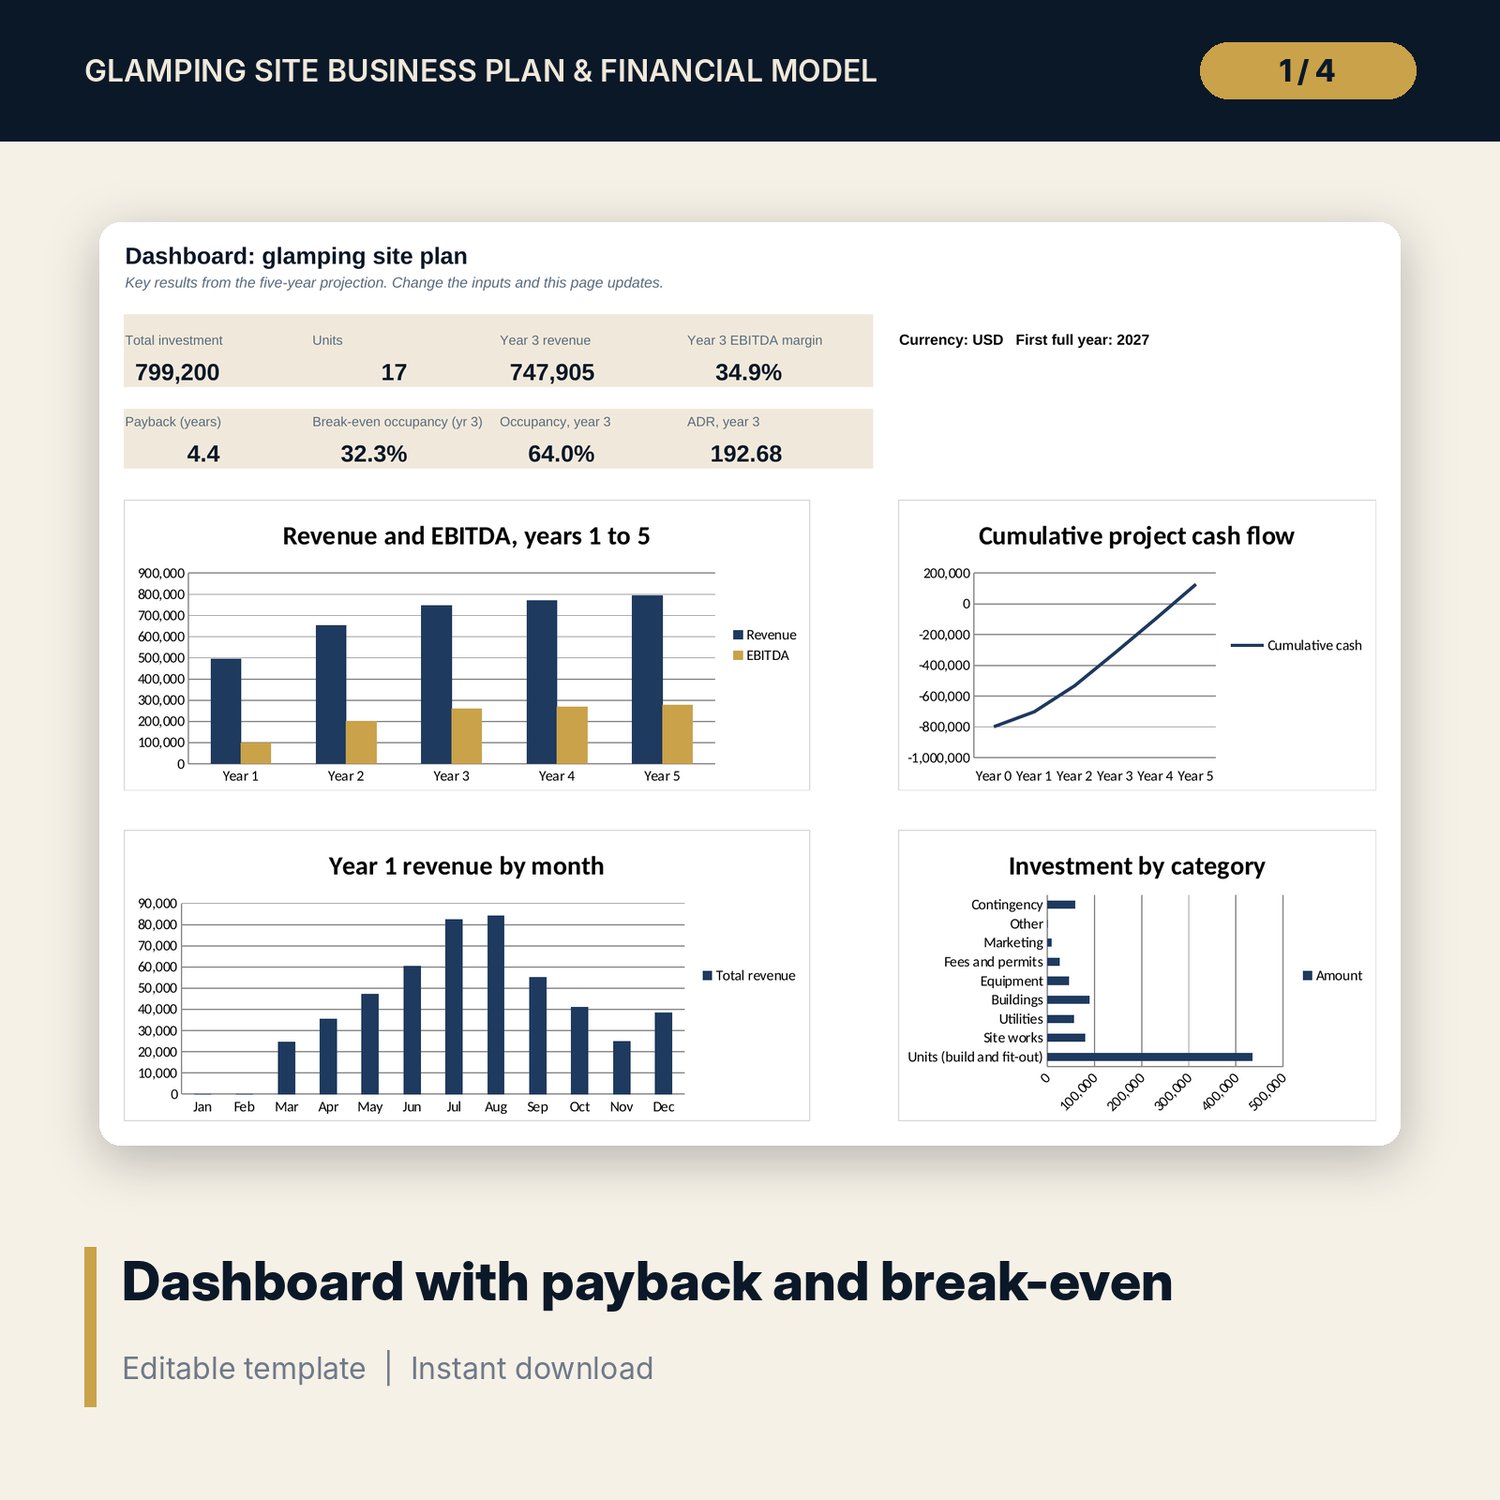
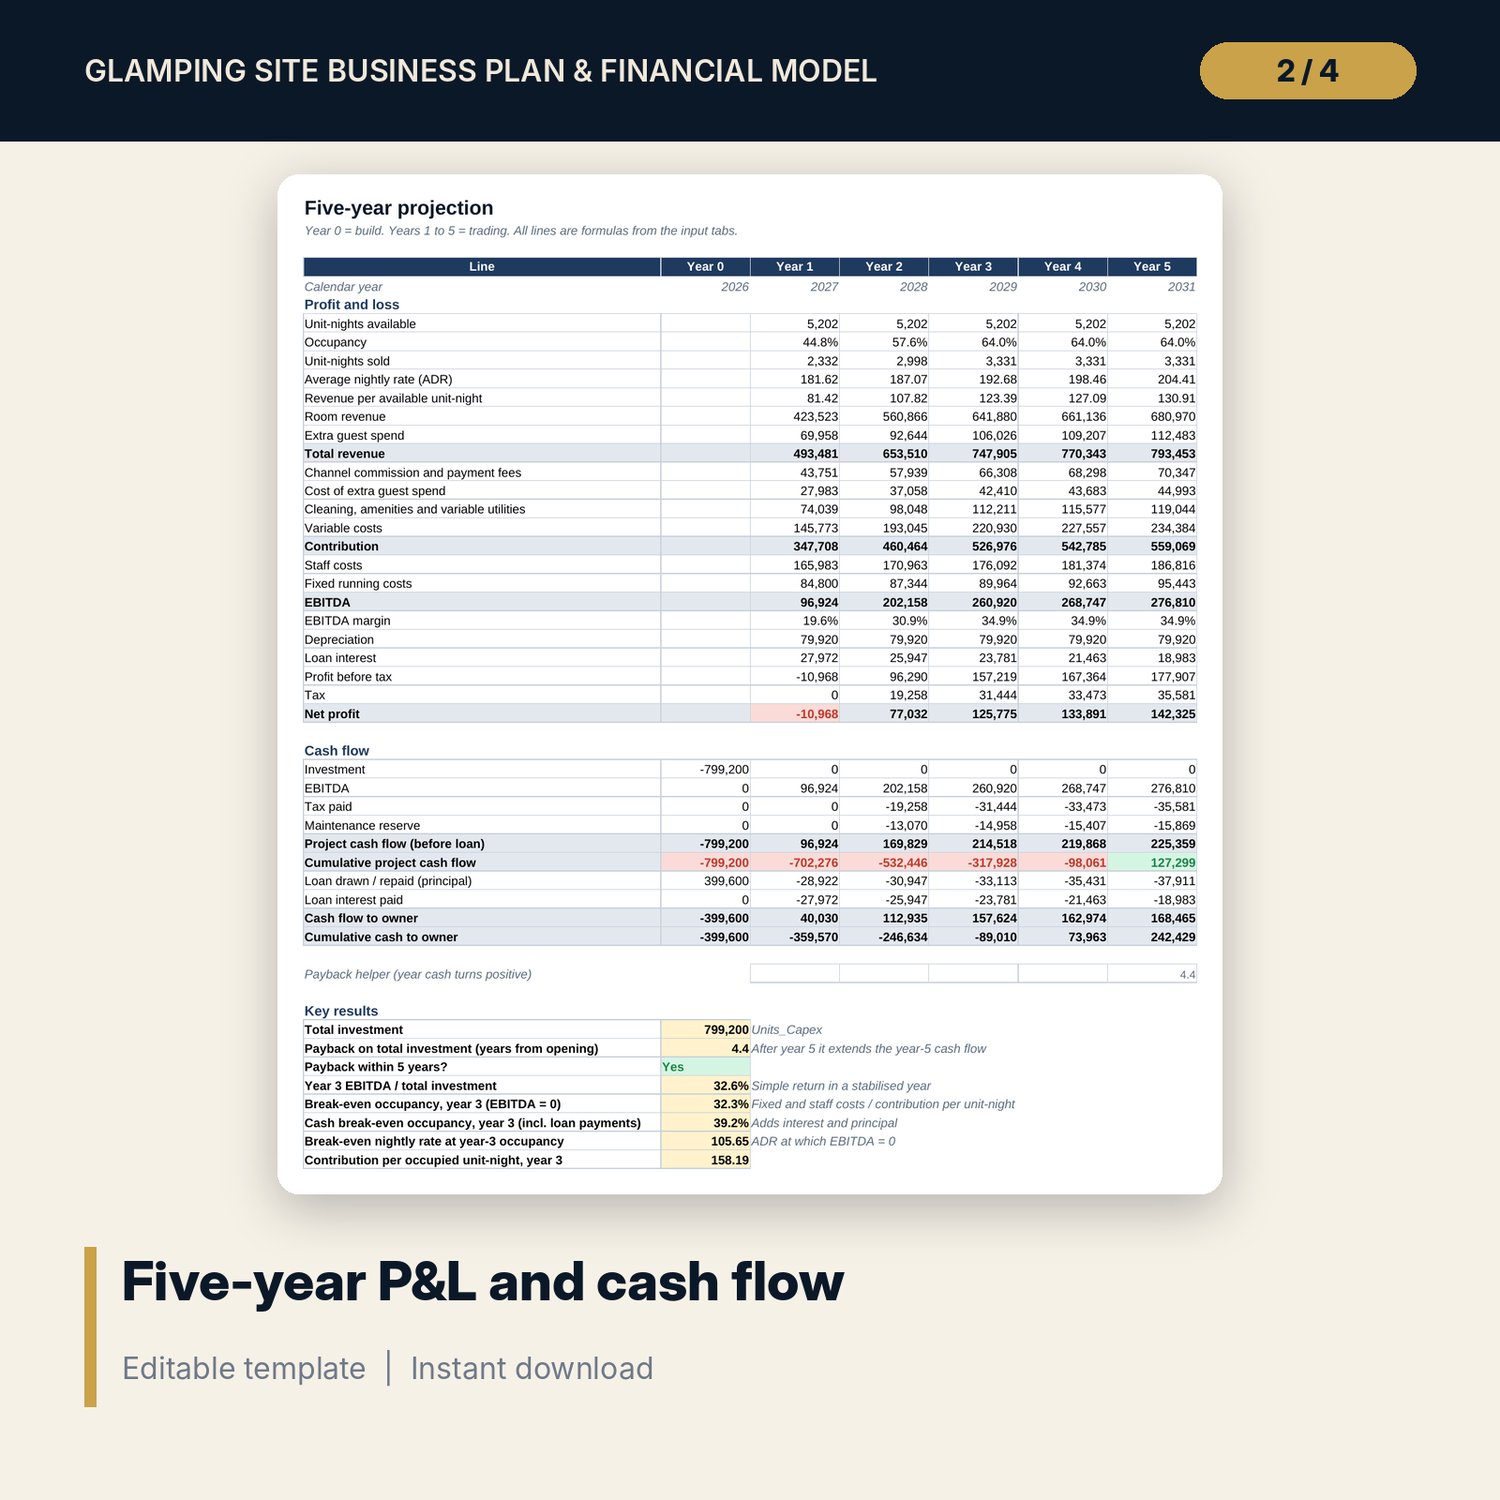
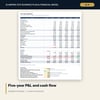
- Projection_5Y: 22 profit and loss lines and 10 cash flow lines for build year plus 5 trading years, and 8 key results including payback, break-even occupancy, cash break-even occupancy and break-even nightly rate.
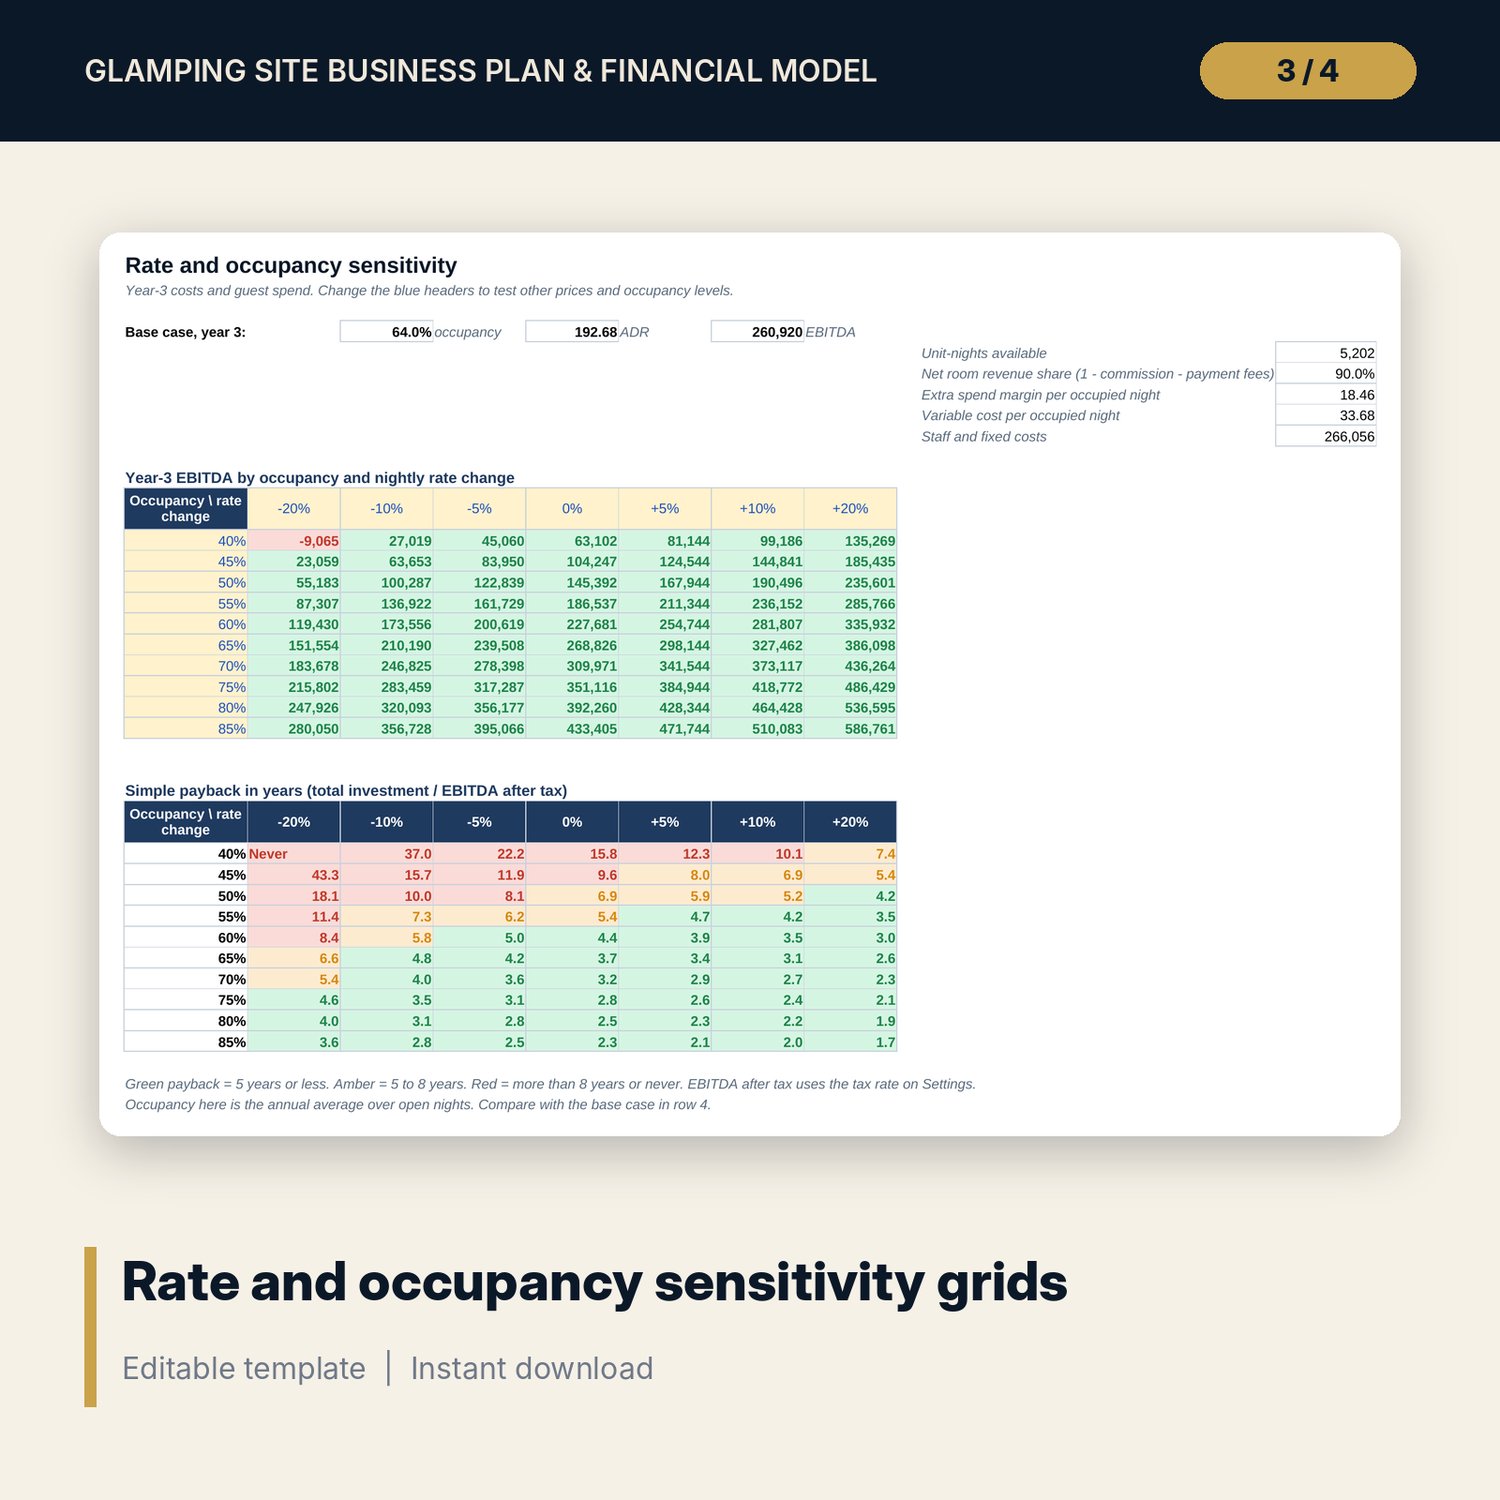
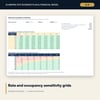
- Sensitivity: two grids of 10 occupancy levels by 7 rate changes, one for year-3 EBITDA and one for simple payback years.
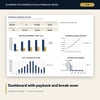
- Dashboard: 8 KPI tiles and 4 charts on one printable page.
- README.txt and LICENSE-and-Terms.txt.
How it works
- Enter growth rates, guest spend, variable costs, tax and loan terms on Settings.
- Set your unit mix, build costs, nightly rates and site works on Units_Capex.
- Enter the months you open and the occupancy and rate index for each on Seasonality.
- List staff roles and fixed running costs on Operating_Costs.
- Read Projection_5Y and the Dashboard, then test prices and occupancy on Sensitivity.
Details
- Format: Excel workbook (.xlsx). No macros.
- Language: English. Currency is a label you choose.
- Software: Excel 2016 or later, or a spreadsheet program that opens .xlsx files.
- Delivery: instant digital download. Nothing is shipped.
Good to know
- All costs, rates, occupancy levels and the sample result are illustrative placeholders, not market data. Get local quotes before you rely on them.
- Planning rules, permits, tax and employment costs differ by location. Verify local requirements.
- The model is a planning tool, not financial or investment advice.
- Single-user license. Do not share or resell the files.
FAQ
Do I need special software?
Excel 2016 or later works best. Other spreadsheet programs that open .xlsx files also work.
Does it work in Google Sheets?
It opens in Google Sheets and the formulas calculate. Check the charts after import.
Can I add other unit types, such as treehouses or shepherd's huts?
Yes. There are 6 unit-type rows. Type the name, number of units, costs and nightly rate in a spare row.
I will not take a loan. What do I change?
Set the loan share to 0% on Settings. The cash flow to owner then equals the project cash flow.
Is this a physical product?
No. It is a digital download. Refund terms follow the store policy at the time of purchase.