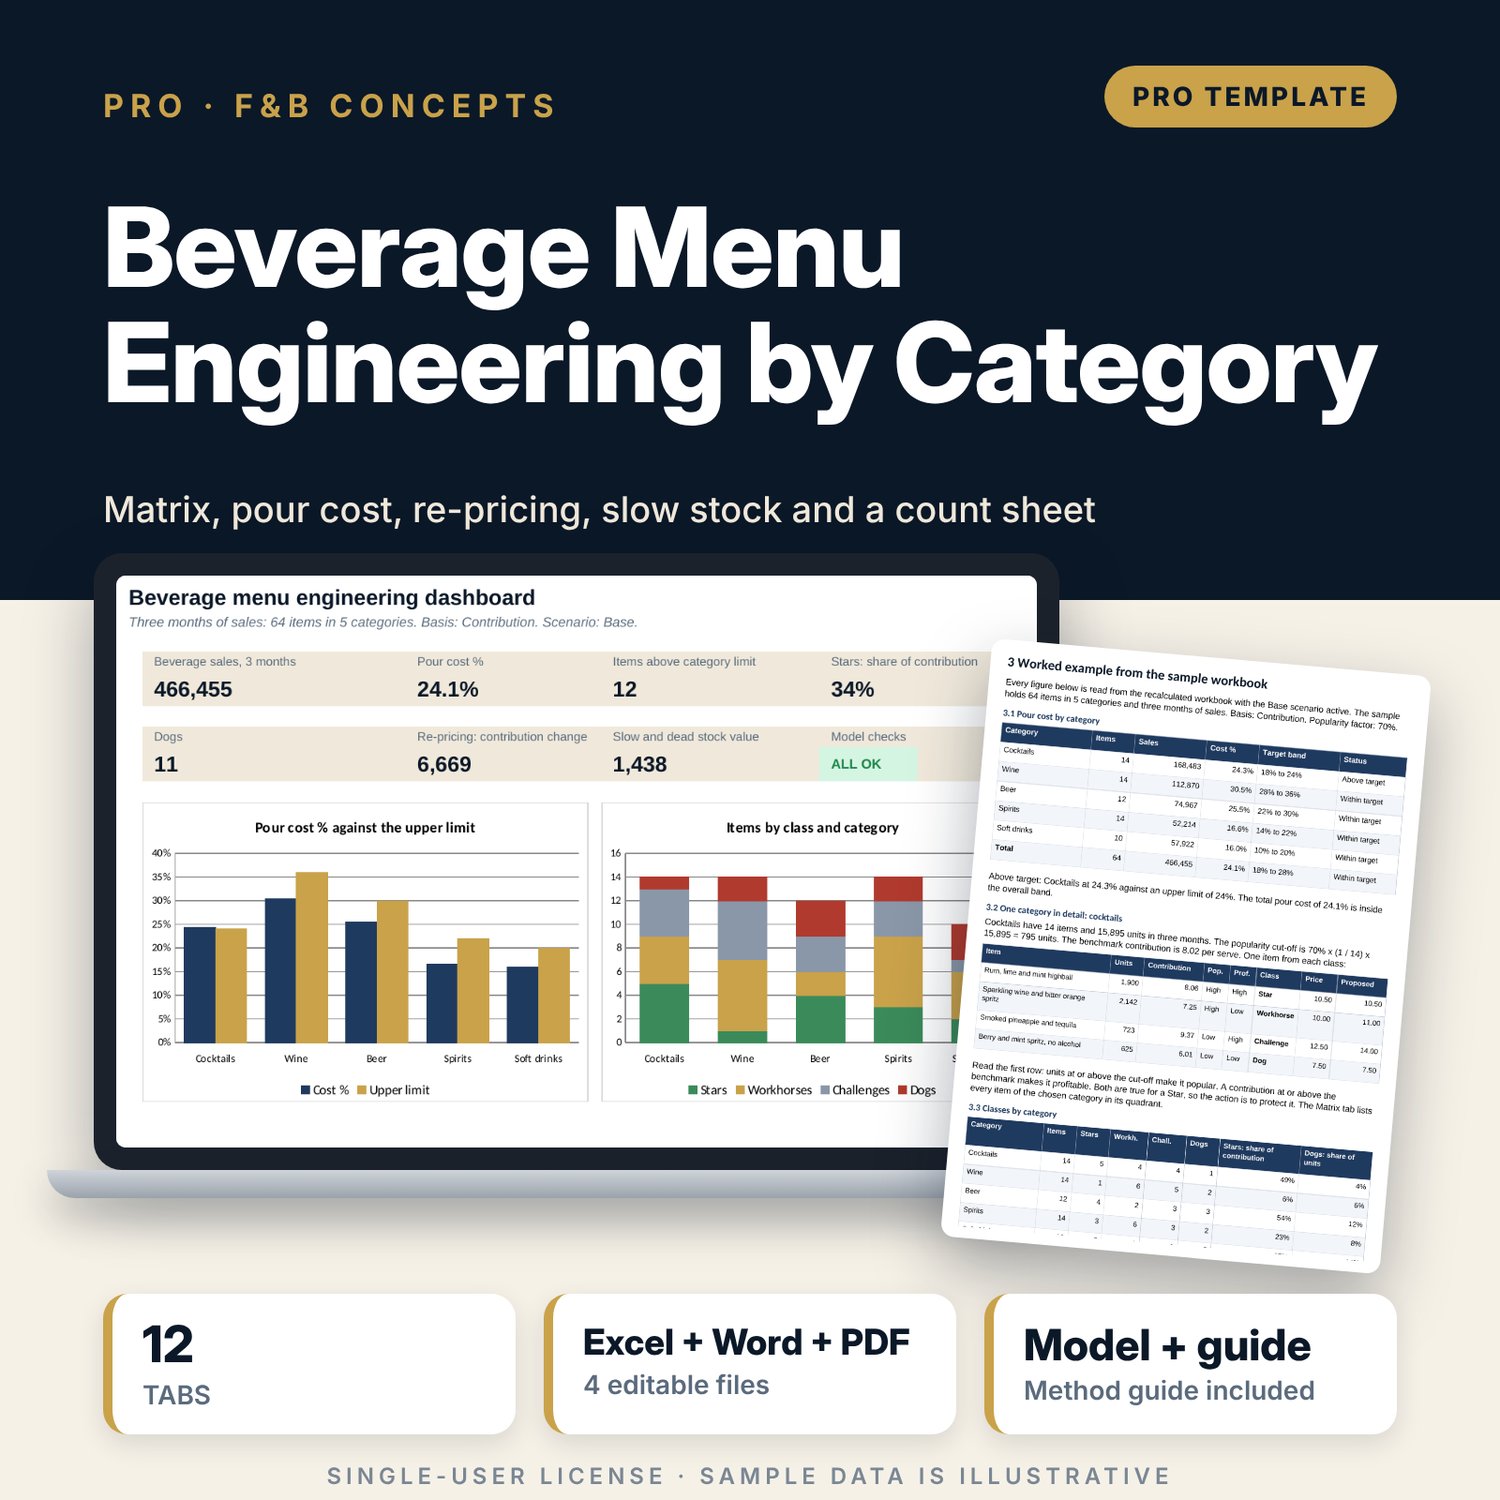
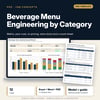
Beverage Menu Engineering by Category: Beverage Menu Engineering Spreadsheet and Count Sheet
Full description
For food and beverage managers, bar managers, beverage leads and cost controllers who must decide which drinks to keep, feature, re-price or remove. The workbook costs 64 sample items in 5 categories, classes each one as Star, Workhorse, Challenge or Dog against its own category benchmark, compares pour cost with a target band, proposes capped price changes and shows the effect with closed-form price-sensitivity grids. It also lists slow and dead stock. A companion count sheet checks stock used against POS sales for 40 stock lines, and a 11-page guide explains the method with a worked example.
What is inside
- Beverage_Menu_Engineering_Workbook.xlsx: 12 tabs, 5,038 formulas, 3 native charts, 22 drop-down and input rules
- Serve Costing: 64 sample items, 13 styles, pack cost, pack size, serve size, waste and extras give the cost per serve, cost % and contribution
- Sales Mix and Engineering: three months of units, trend, days since last sale, stock on hand and 23 audit columns that class every item
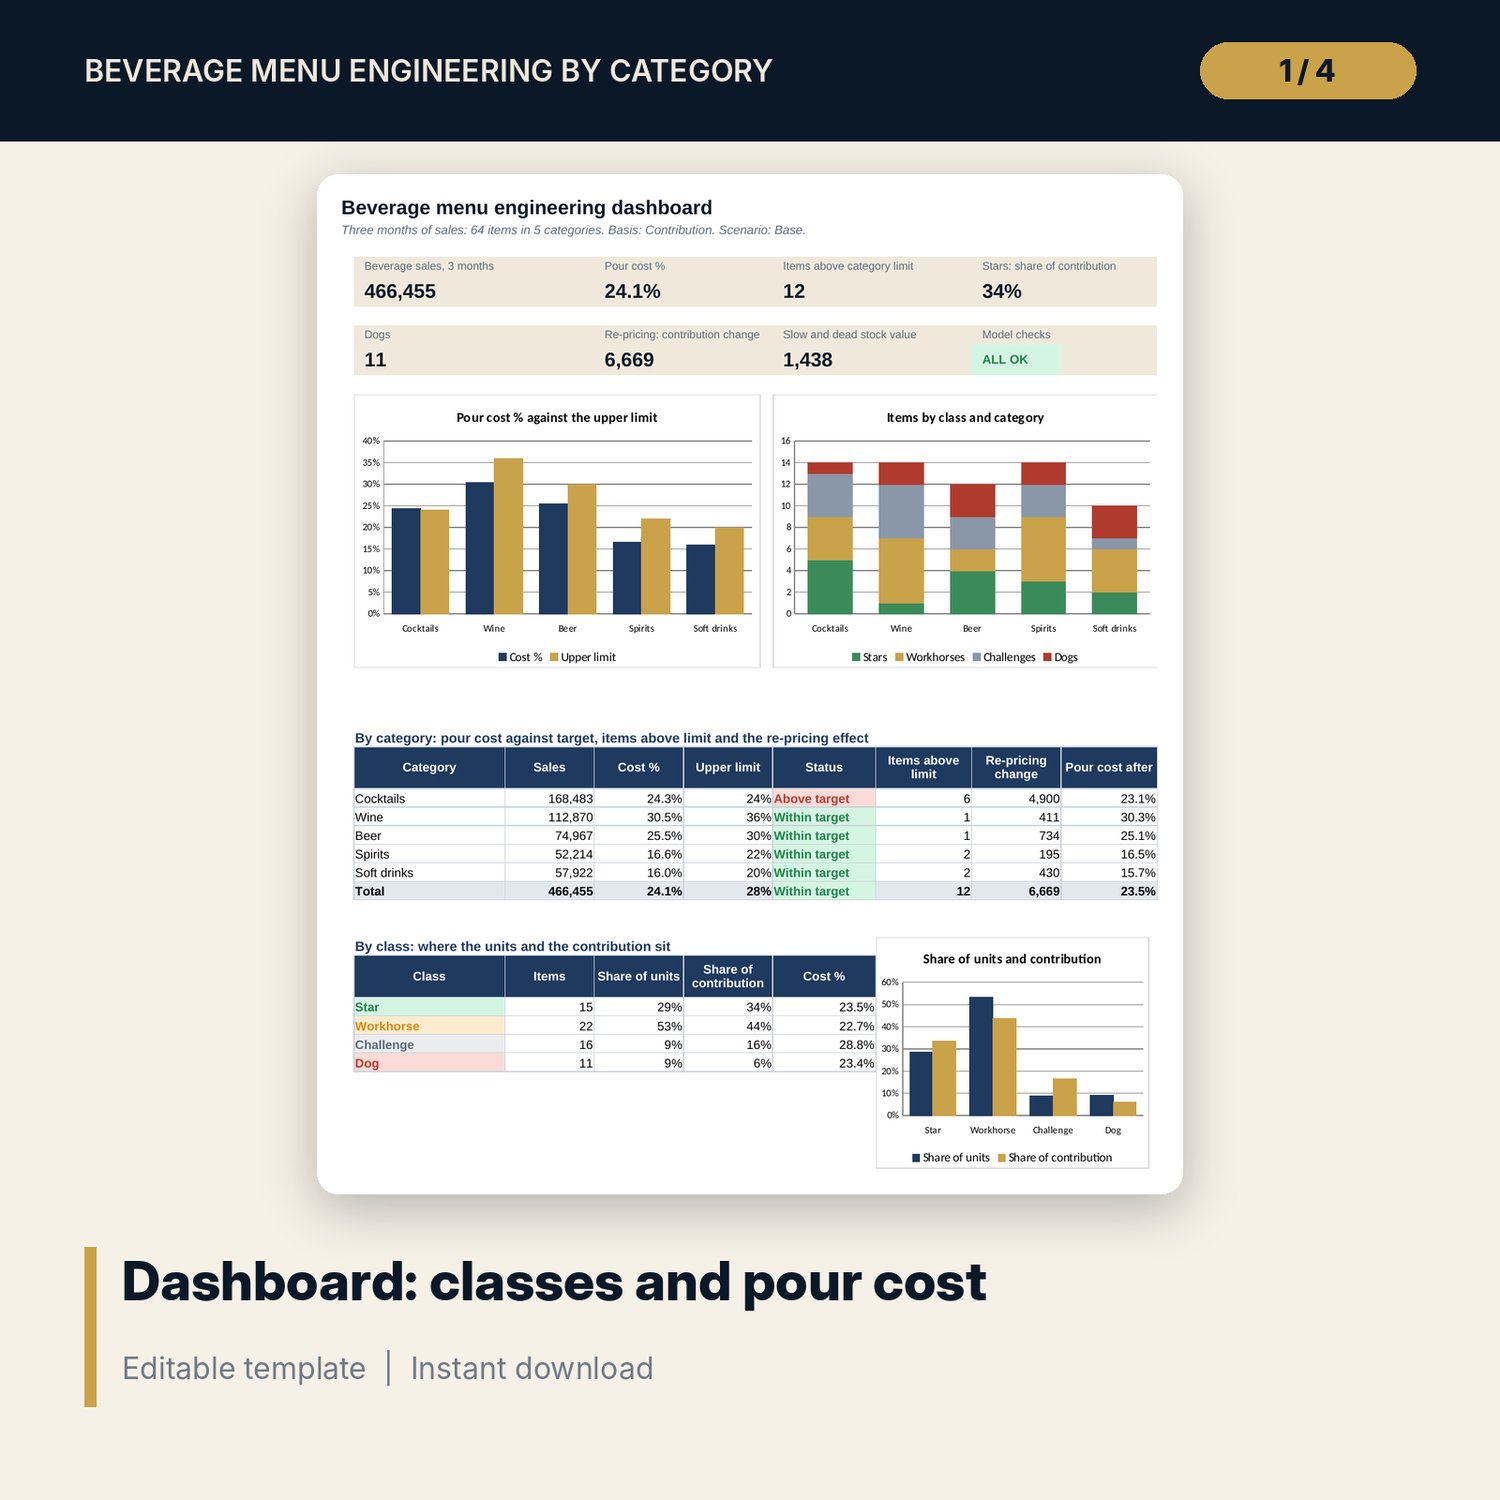
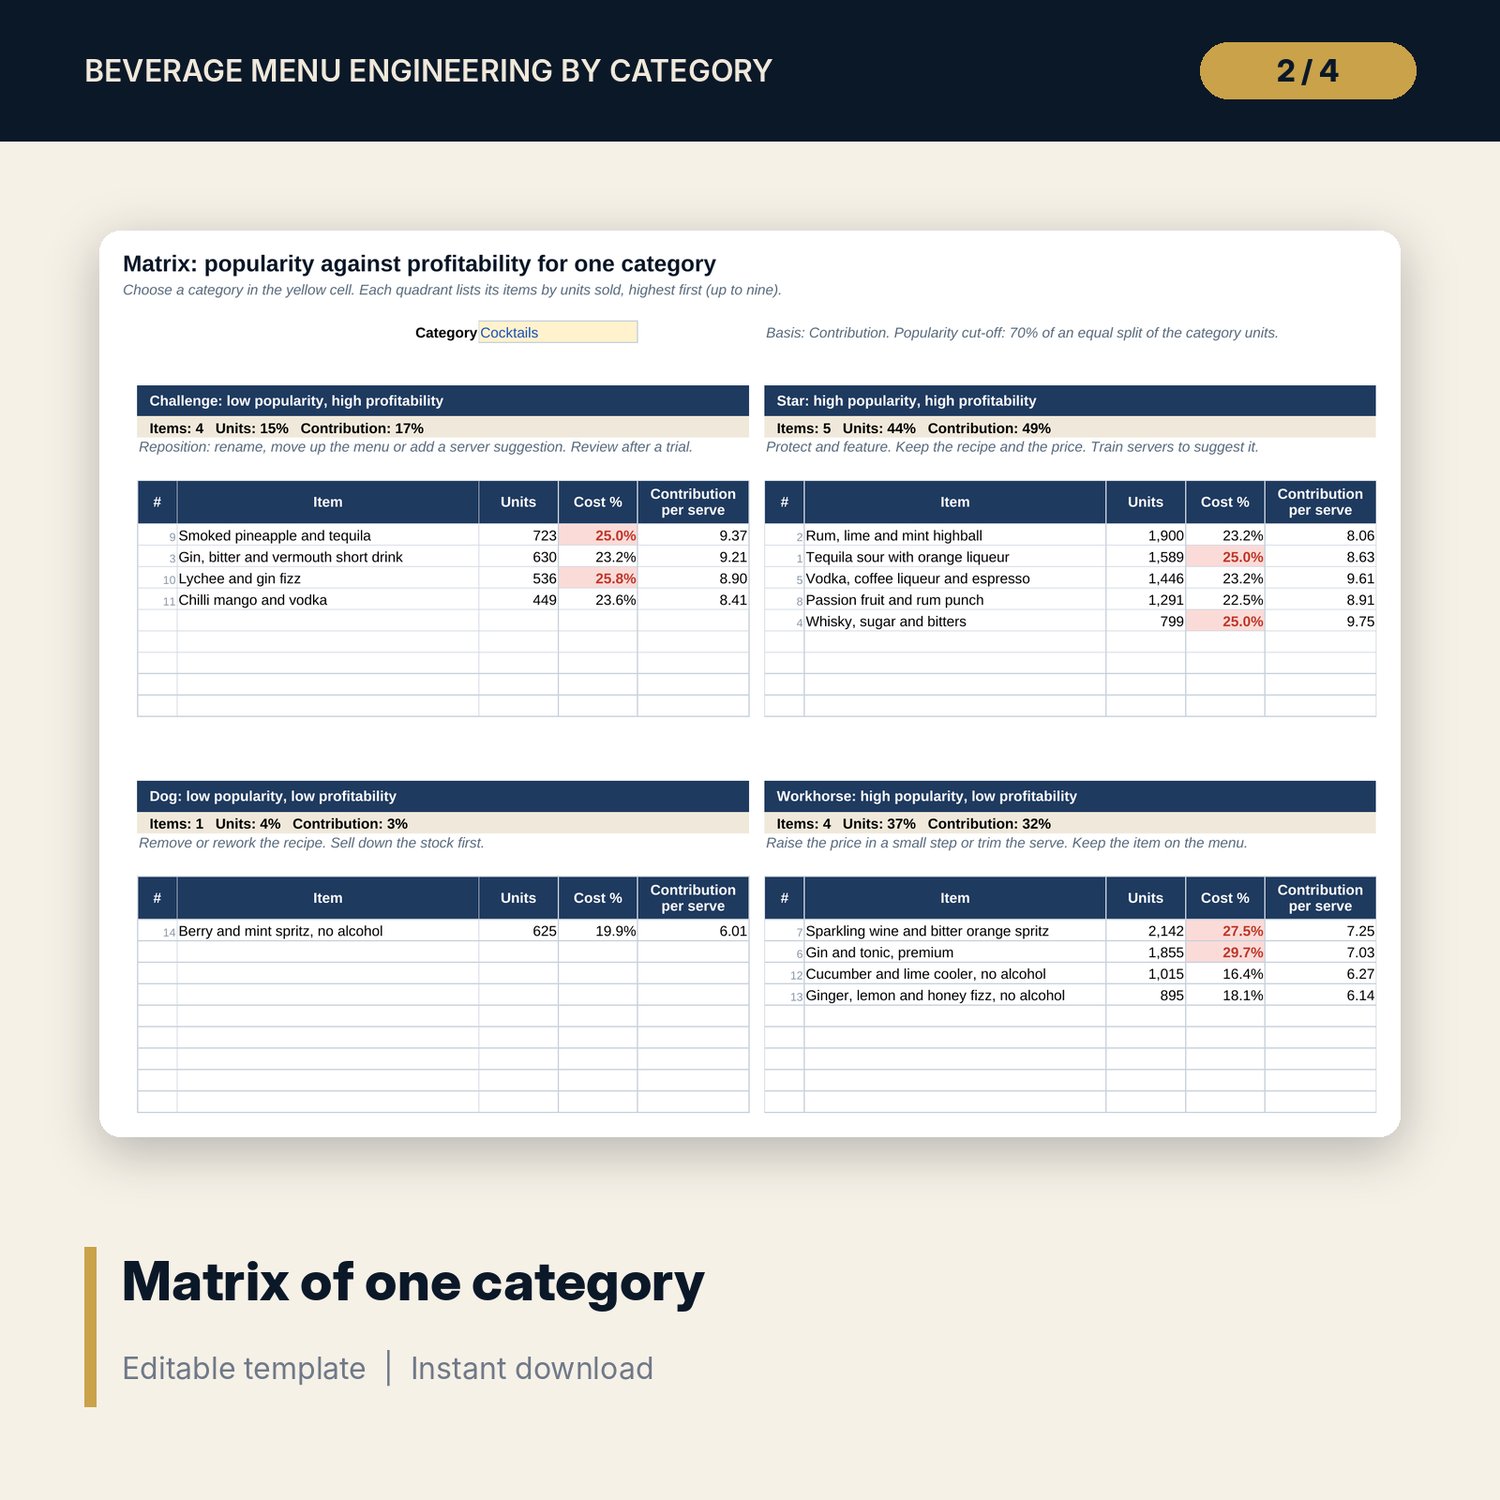
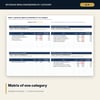
- Categories and Matrix: pour cost against a band for 5 categories, benchmarks, class counts, 6 bar menu standards and the four quadrants of any category
- Repricing and the what-if block: proposed prices with a rise cap, projected units and contribution, a three-case price scenario, two 20-cell sensitivity grids and a break-even elasticity
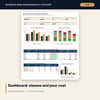
- Stock Actions: 15-line ranked list of slow and dead stock with a tactic and an approver; Dashboard with 7 tiles, a check tile and 3 charts; 13 checks; Method tab with 18 rows
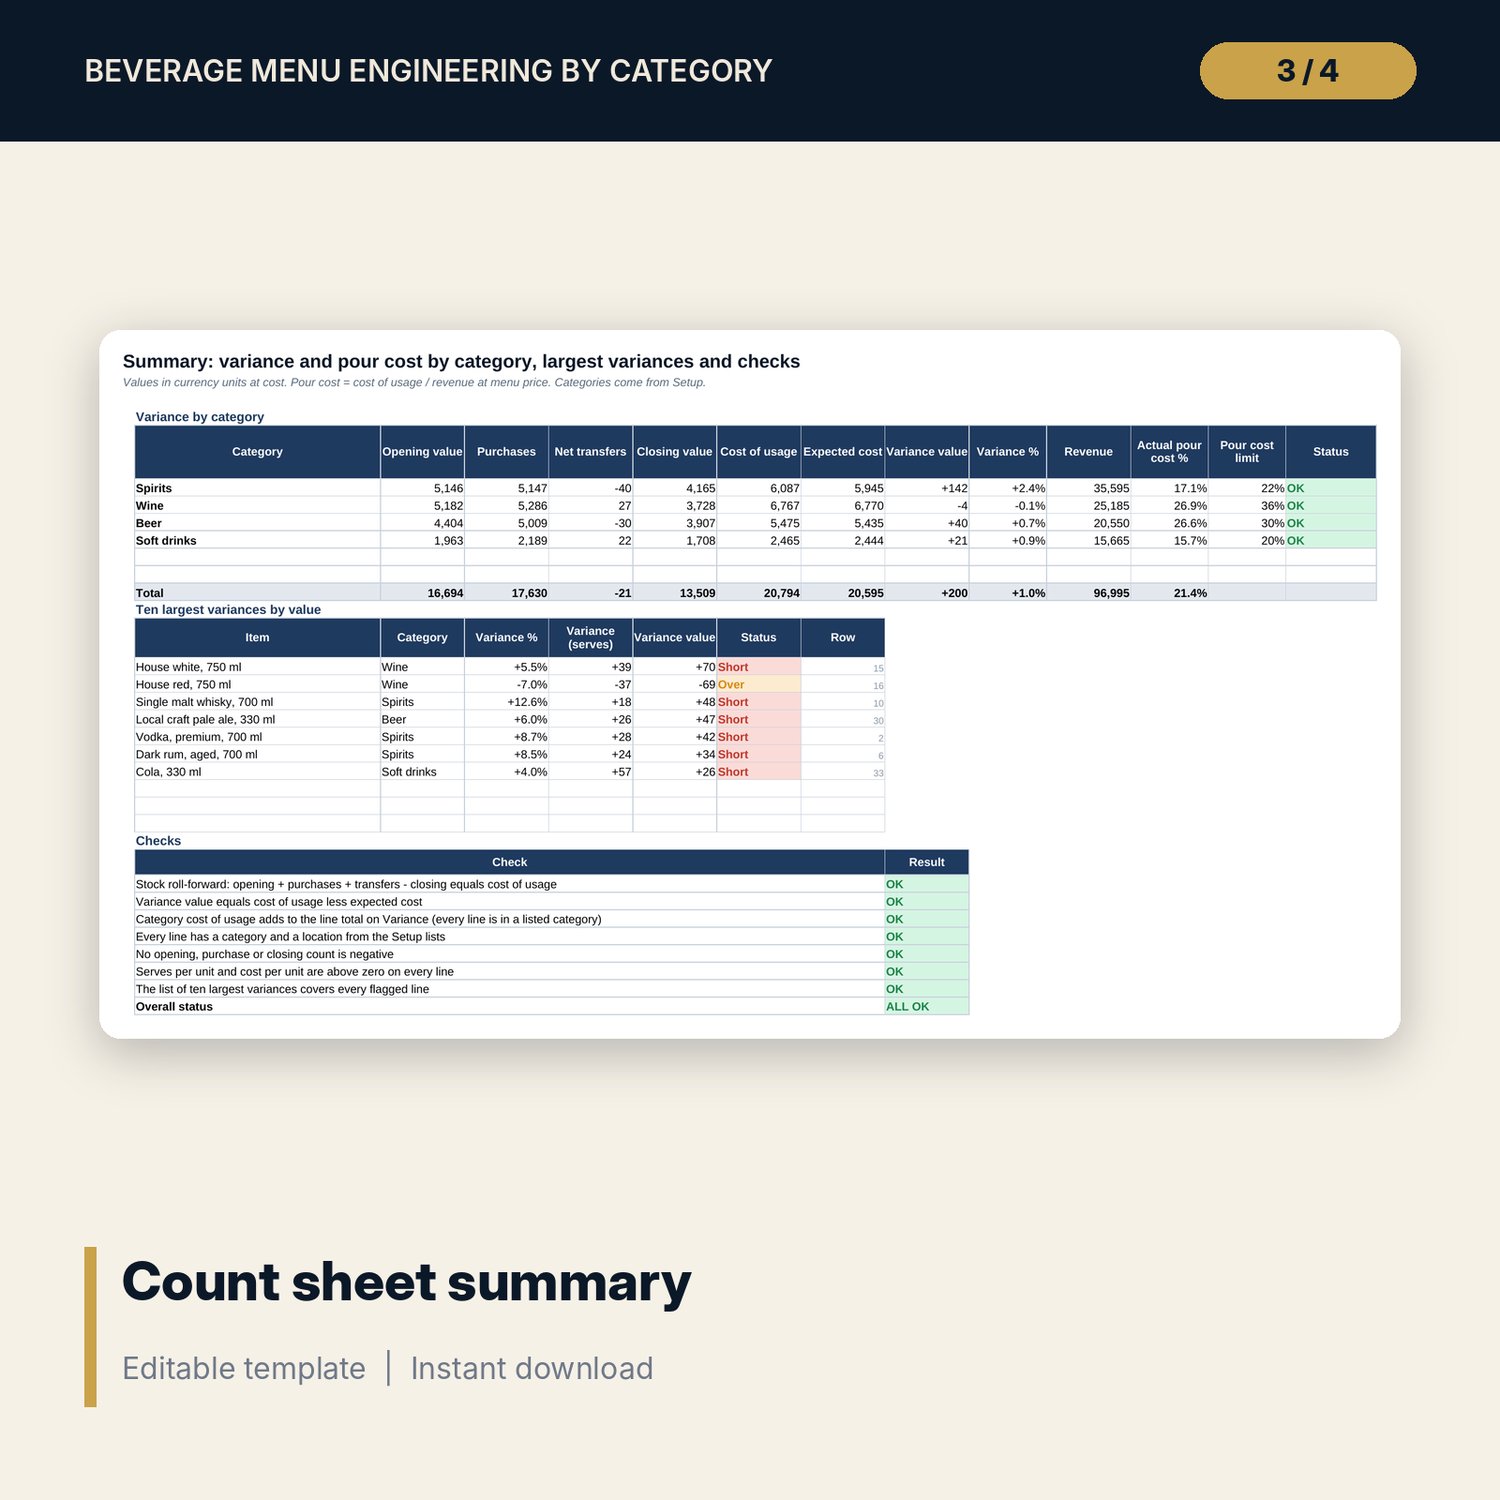
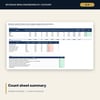
- Beverage_Count_Sheet.xlsx: 5 tabs, 1,030 formulas, 40 stock lines and 8 spare rows, usage and variance by line and category, order quantity from par, 7 checks
- Beverage_Menu_Engineering_Guide.docx and PDF: 11 pages with equations, a worked example read from the workbook, a trial log, a count procedure, bar menu standards and a quarterly checklist
- README.txt and LICENSE-and-Terms.txt
How it works
- Enter your items on Serve Costing and three months of units on Sales Mix.
- Set the popularity factor, the profitability basis and the category targets on Assumptions.
- Read the class of every item, the pour cost of every category and the proposed prices.
- Test the effect with the what-if grids, trial the changes for four weeks, then apply them.
- Use the count sheet at each stock count to compare usage with sales.
Details
- Formats: 2 Excel workbooks (.xlsx), 1 guide in Word (.docx) and PDF, English
- Software: Excel 2016 or later, or LibreOffice Calc 7 or later
- No macros, no external links, no data tables, no array formulas
- 4 files plus README and license; instant digital download
Good to know
- Sample data is illustrative. Replace it with your own figures.
- The files are planning tools, not financial, tax or legal advice. Verify local rules on alcohol labelling, pricing display and stock write-offs.
- Price sensitivity is an estimate. Use the grids as a range and trial every change.
- Single-user license. Do not redistribute.
FAQ
How are items classed?
Popularity compares units with a cut-off for the category (70% of an equal split by default). Profitability compares contribution per serve, or cost %, with the category benchmark. Both rules are inputs.
Can I use cost % instead of contribution?
Yes. One switch on Assumptions changes the basis for every sheet, so the whole workbook stays on one basis.
Does it set prices for me?
It proposes prices from a target mid-point, a rounding step and a rise cap, and shows the effect for a range of price sensitivities. You decide after a trial.
What does the count sheet do?
It compares stock used (opening + purchases + transfers - closing) with POS serves and waste, by line and by category, and flags variances above your tolerance.
Do I need macros or add-ins?
No. Every result is a standard worksheet formula, including the sensitivity grids.