Cloud Kitchen Business Plan & Financial Model: Ghost Kitchen 24-Month Projection Spreadsheet
Full description
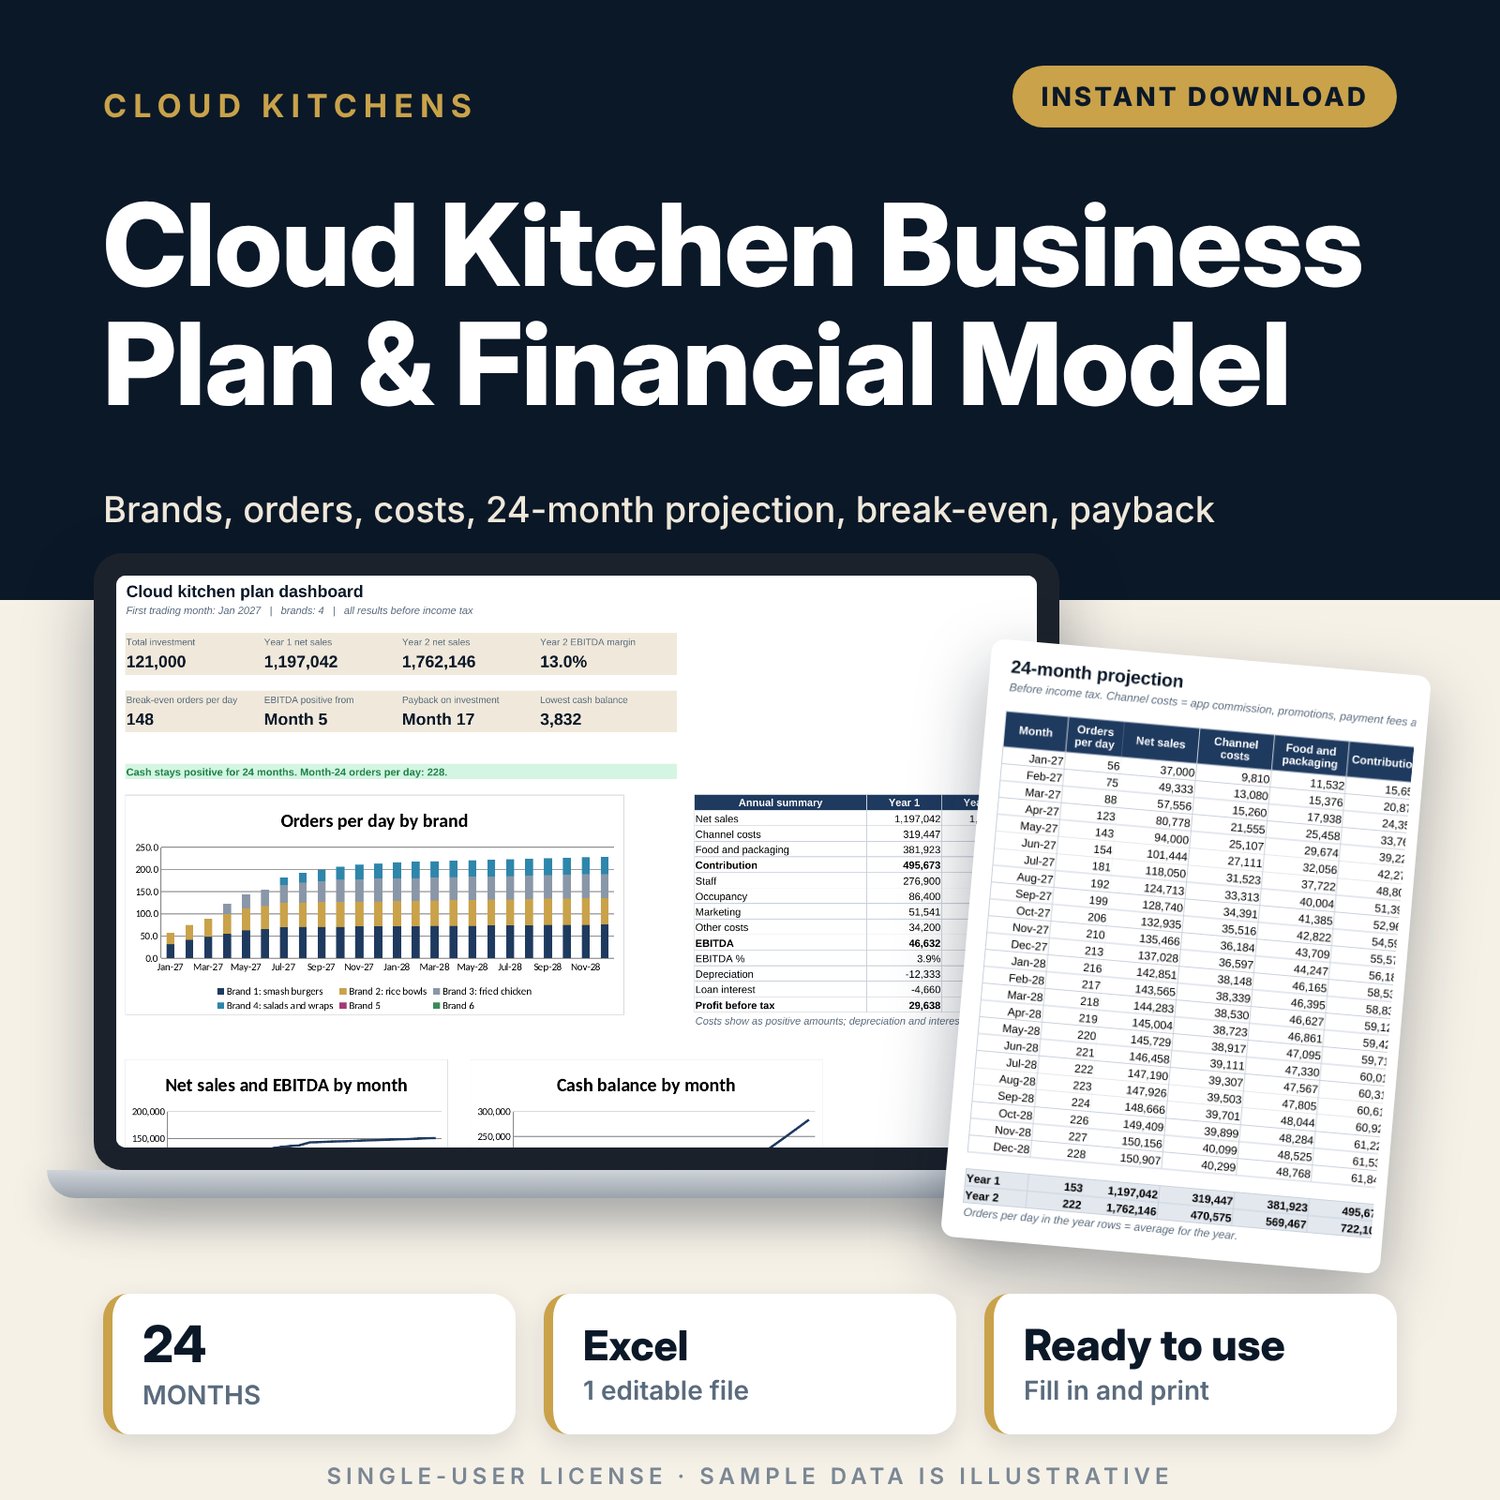
For founders, chefs and restaurant operators planning a delivery-only kitchen that runs several virtual brands from one site. You enter each brand's launch month, expected orders per day, order value, food and packaging cost and app share, then your staff plan, rent, running costs, fit-out budget and funding. The model ramps each brand up month by month and returns 24 months of sales, costs, EBITDA and cash, the break-even orders per day, the payback month on the investment and a sensitivity grid for orders and order value.
Save with a bundle: this template is also in the Food & Leisure Business Startup Bundle, 14 templates for $35 instead of $103. All 141 templates are in the All-Access Hospitality Template Library for $79.
What is inside
- Cloud_Kitchen_Financial_Model.xlsx: 9 tabs, 912 formulas, 4 native charts, 7 drop-down or number rules.
- Settings: 13 assumptions (start month, days open, tax, app commission, promotions, payment fee, own delivery cost, variable marketing, growth, price and cost increases) and a 6-month ramp-up curve.
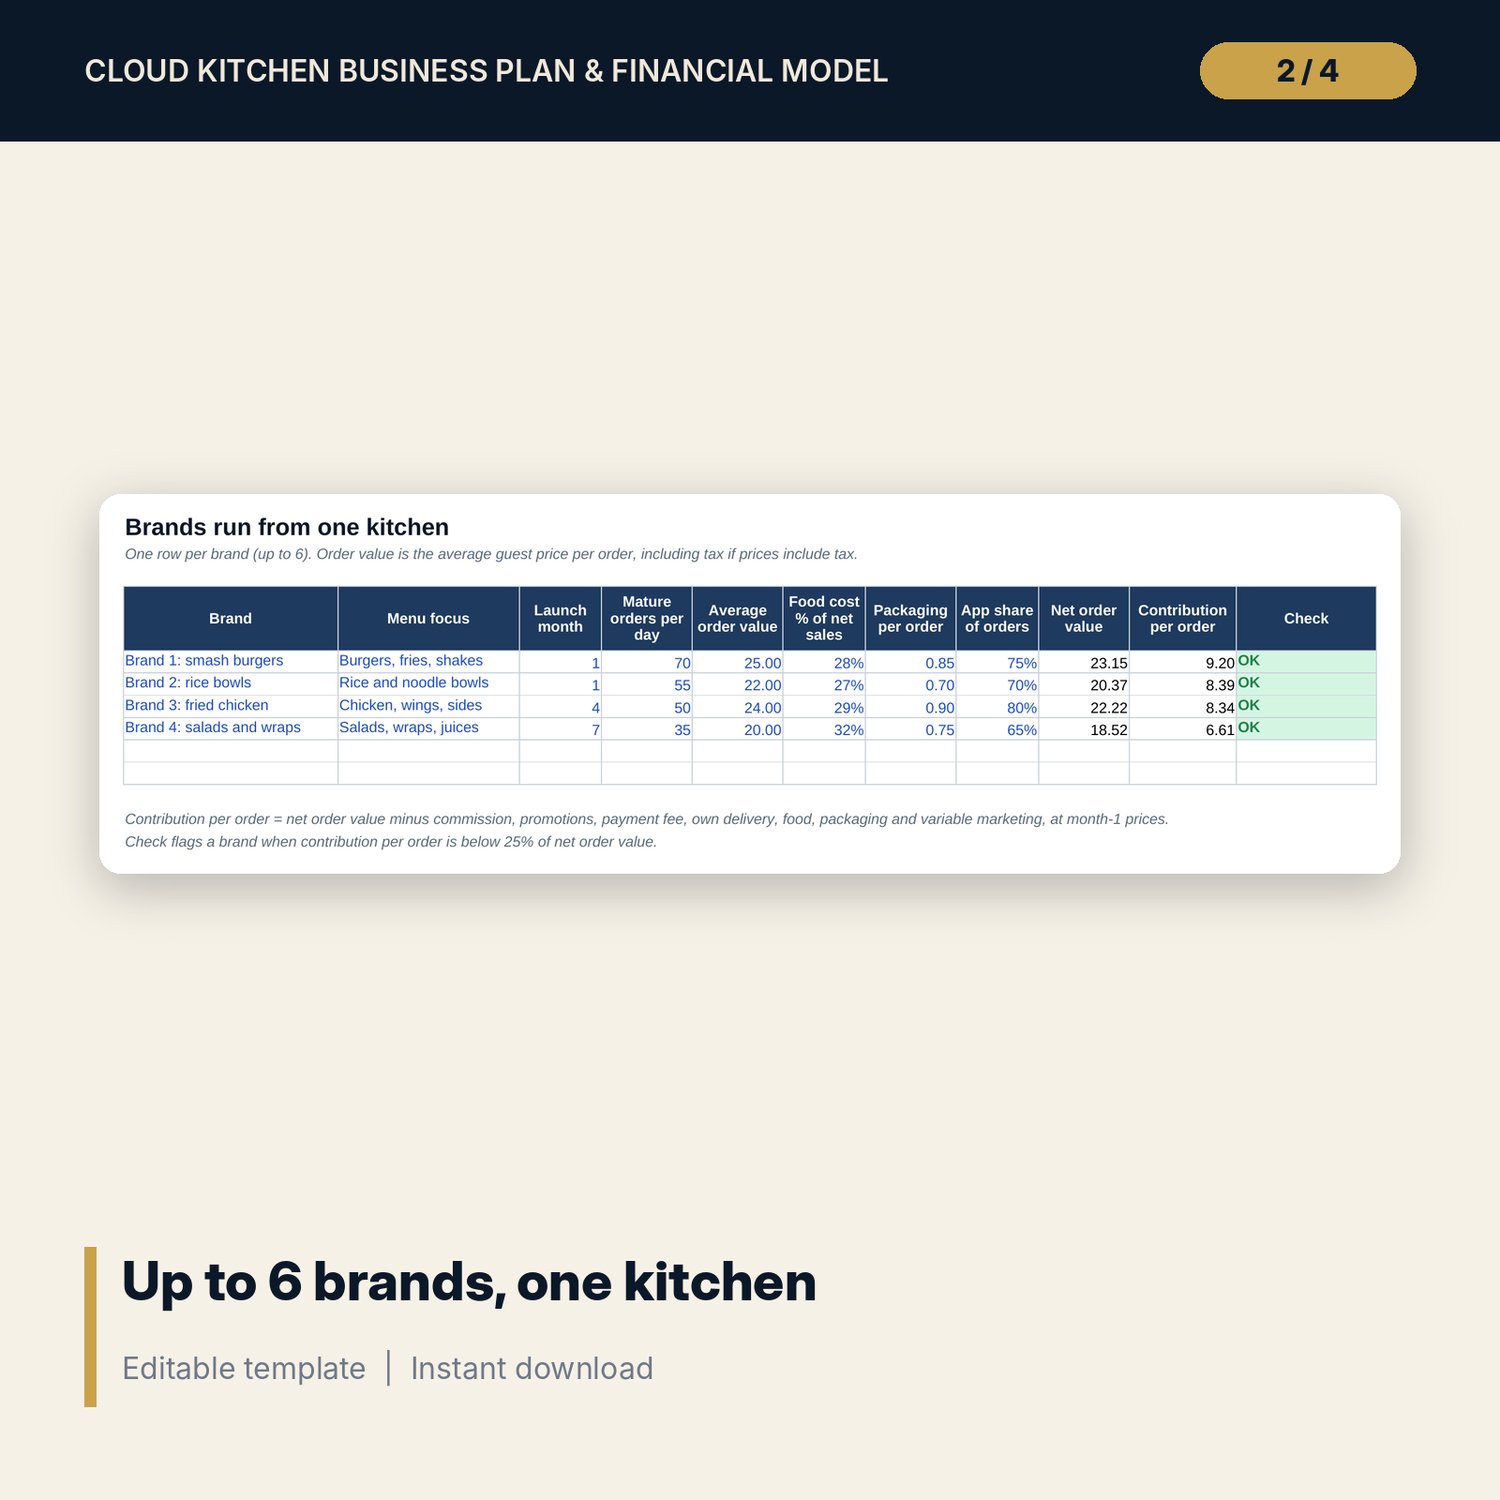
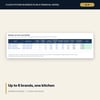
- Brands: up to 6 brands (4 samples) with launch month, mature orders per day, order value, food cost %, packaging and app share. Net order value, contribution per order and a check for each.
- Costs: staff plan with room for 10 roles (7 samples) and start months, and running costs with room for 18 lines (12 samples) by category.
- Capex: room for 20 fit-out and launch items (12 samples) with depreciation, plus funding: owner equity, loan, rate, term, monthly payment and opening cash.
- Monthly_Workings: orders per day for each brand over 24 months, with sales, app sales, own orders, food and packaging totals.
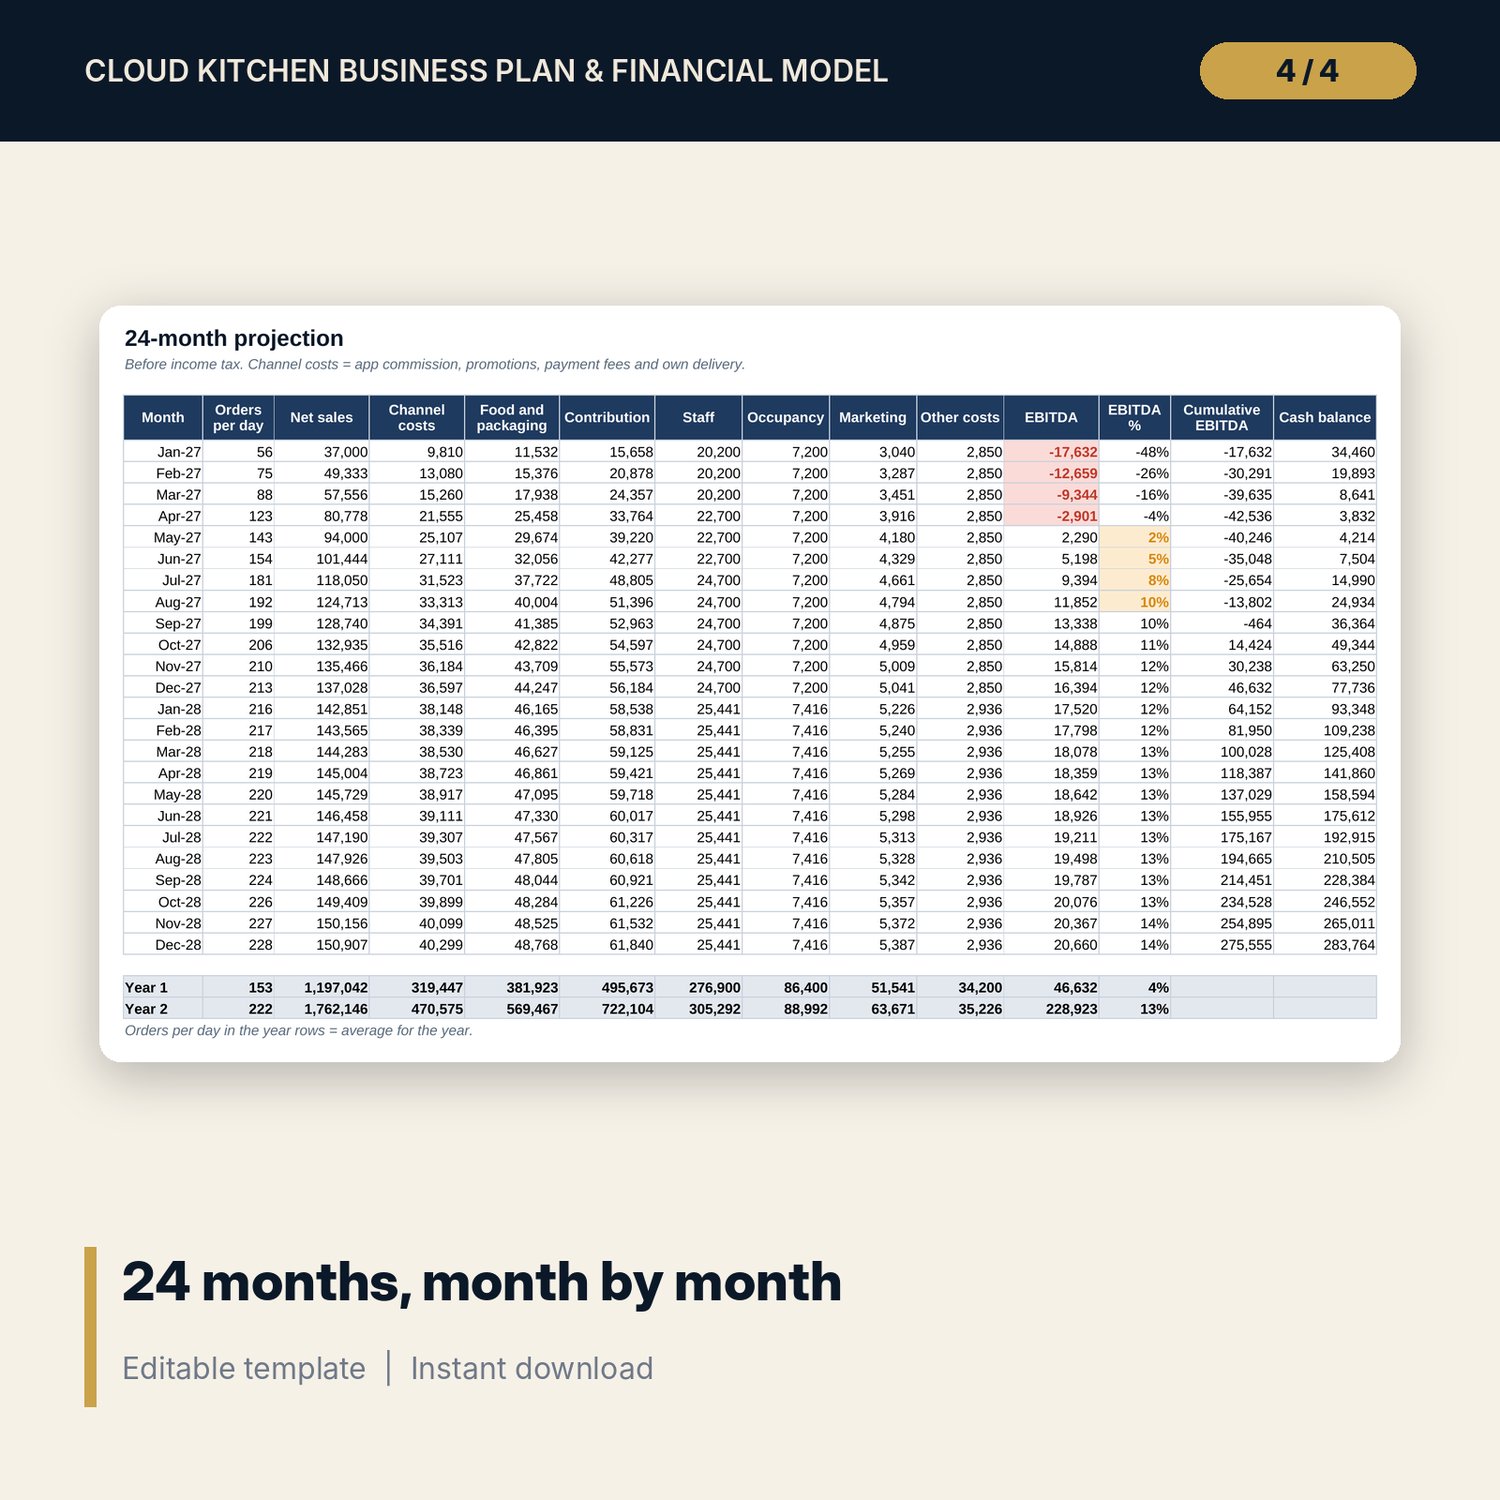
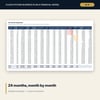
- Projection_24M: 24 months of orders per day, net sales, channel costs, food and packaging, contribution, staff, occupancy, marketing, other costs, EBITDA, cumulative EBITDA and cash balance, with Year 1 and Year 2 totals.
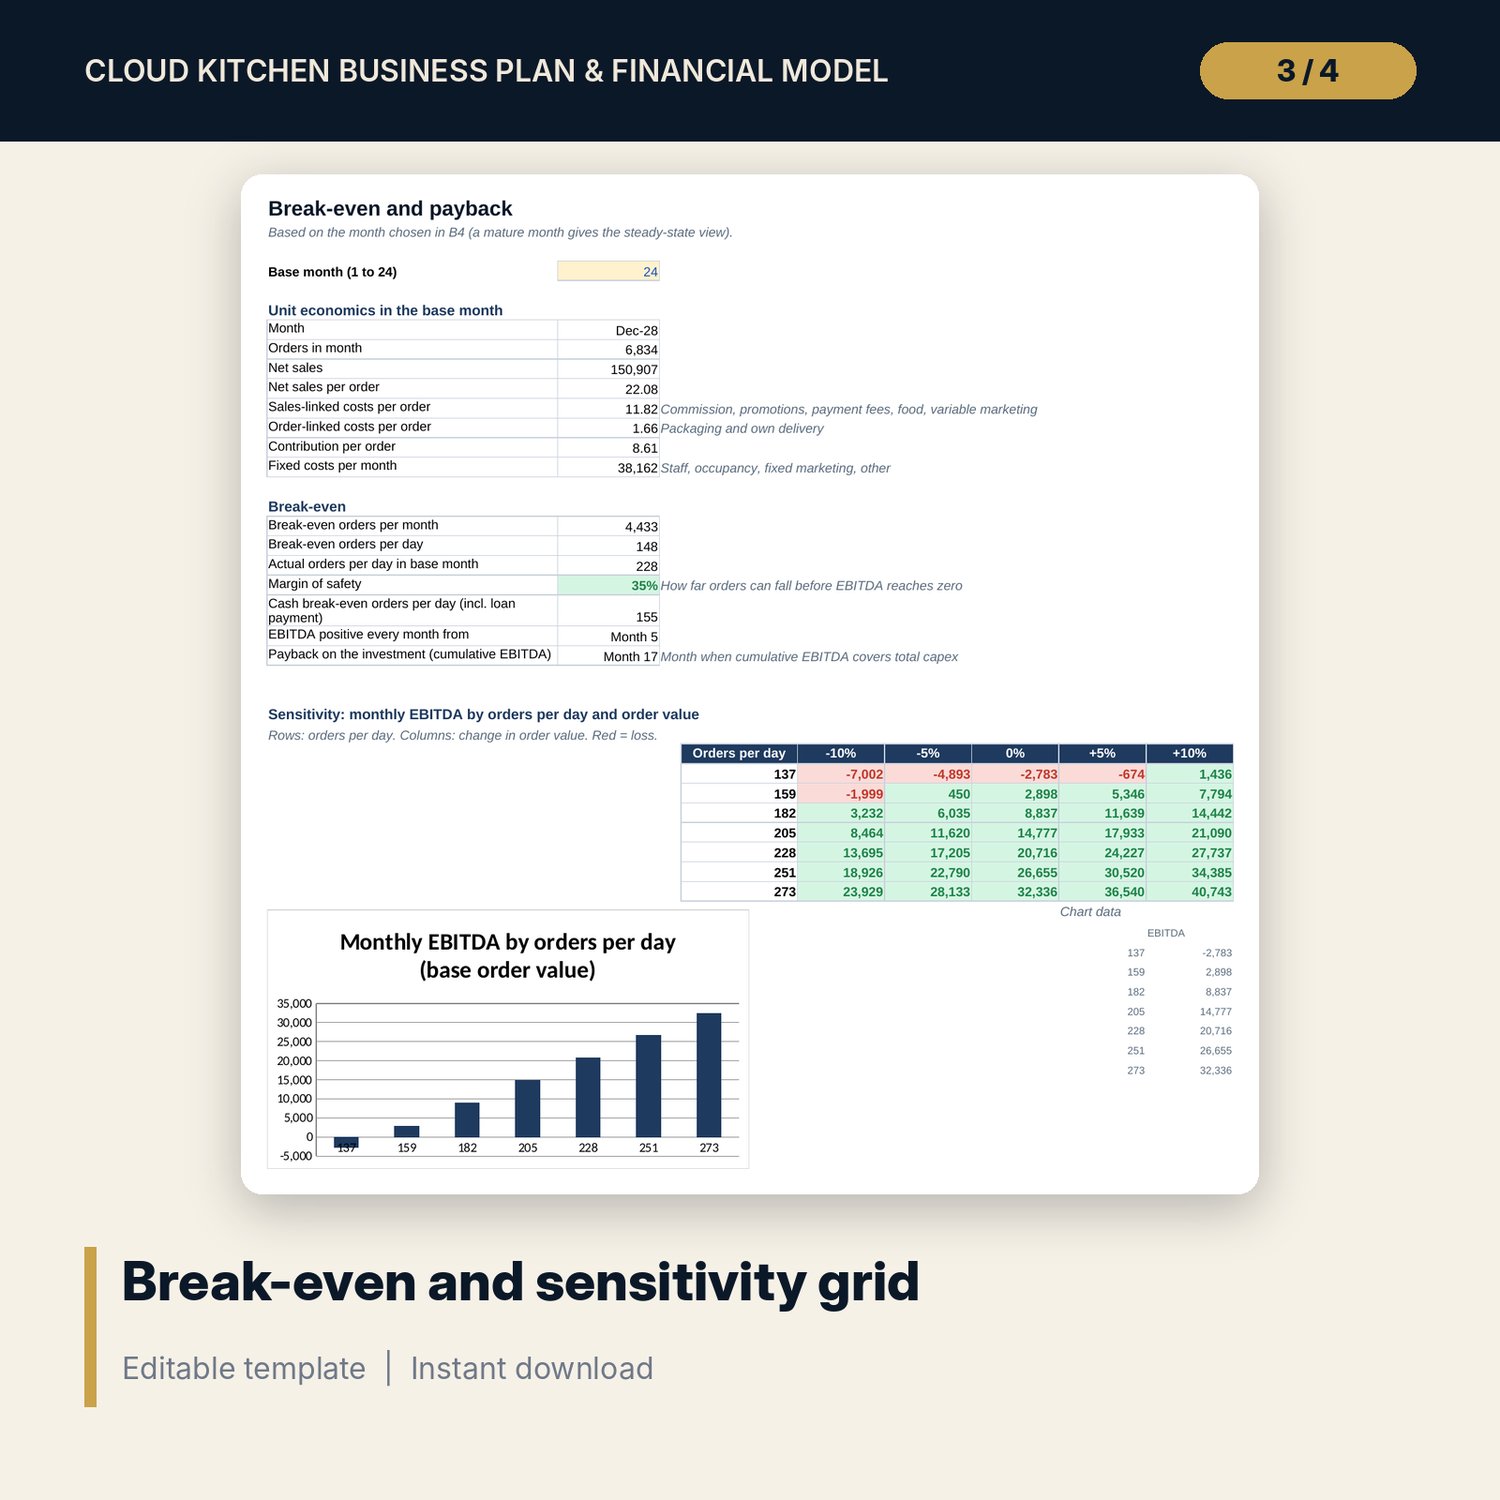
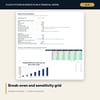
- Break_Even: unit economics for a chosen month, break-even orders per day, margin of safety, cash break-even, payback month and a 7 x 5 sensitivity grid with a chart.
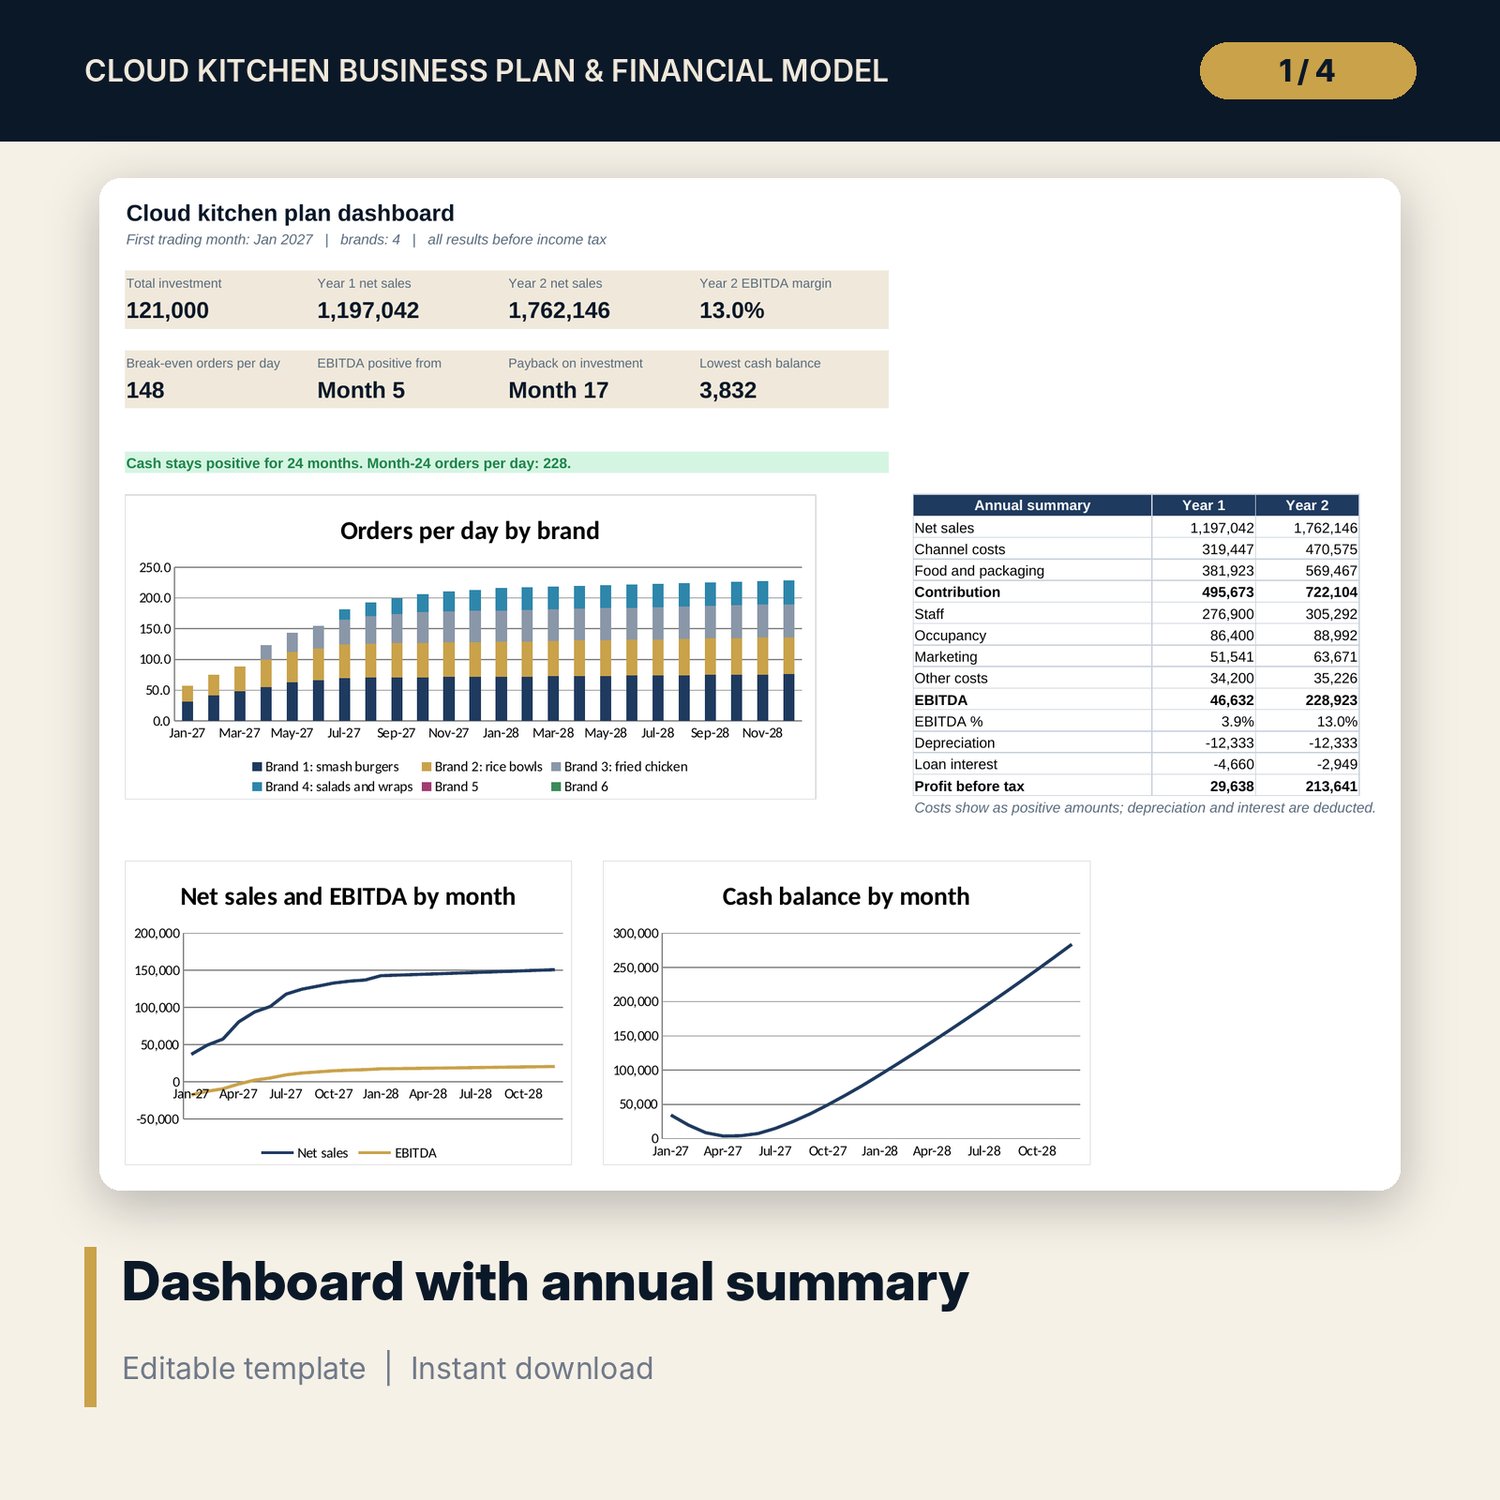
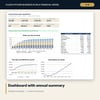
- Dashboard: 8 KPI tiles, a 13-line annual summary down to profit before tax, and 3 charts (orders by brand, sales and EBITDA, cash balance).
- README.txt and LICENSE-and-Terms.txt.
How it works
- Enter the start month, tax rule and delivery app terms on Settings.
- List your brands with launch months and expected orders per day.
- Enter staff, rent, running costs, fit-out budget and funding.
- Read the 24-month projection, break-even and payback, then test changes one at a time.
Details
- Format: Excel workbook (.xlsx). No macros.
- Language: English. Currency is a label you choose.
- Software: Excel 2016 or later, or a spreadsheet program that opens .xlsx files.
- Delivery: instant digital download. Nothing is shipped.
Good to know
- All sample brands, volumes, prices, costs and funding figures are illustrative. Replace them with your own research and quotes.
- Results are before income tax. This is a planning model, not financial, legal or tax advice.
- Sales tax, permits and employment costs differ by place. Verify local requirements.
- Single-user license. Do not share or resell the files.
FAQ
Can I model one brand only?
Yes. Fill in one row on Brands and leave the others blank.
Can brands launch at different times?
Yes. Each brand has a launch month from 1 to 24 and follows the ramp-up curve from that month.
How is break-even calculated?
Fixed costs per month divided by contribution per order in the month you choose, then divided by days open.
What software do I need?
Excel 2016 or later, or another spreadsheet program that opens .xlsx files.
Is this a physical product?
No. It is a digital download. Refund terms follow the store policy at the time of purchase.