
Hotel Variance Bridge & Flow-Through Analyzer: hotel budget vs actual variance analysis with GOP bridge
Full description
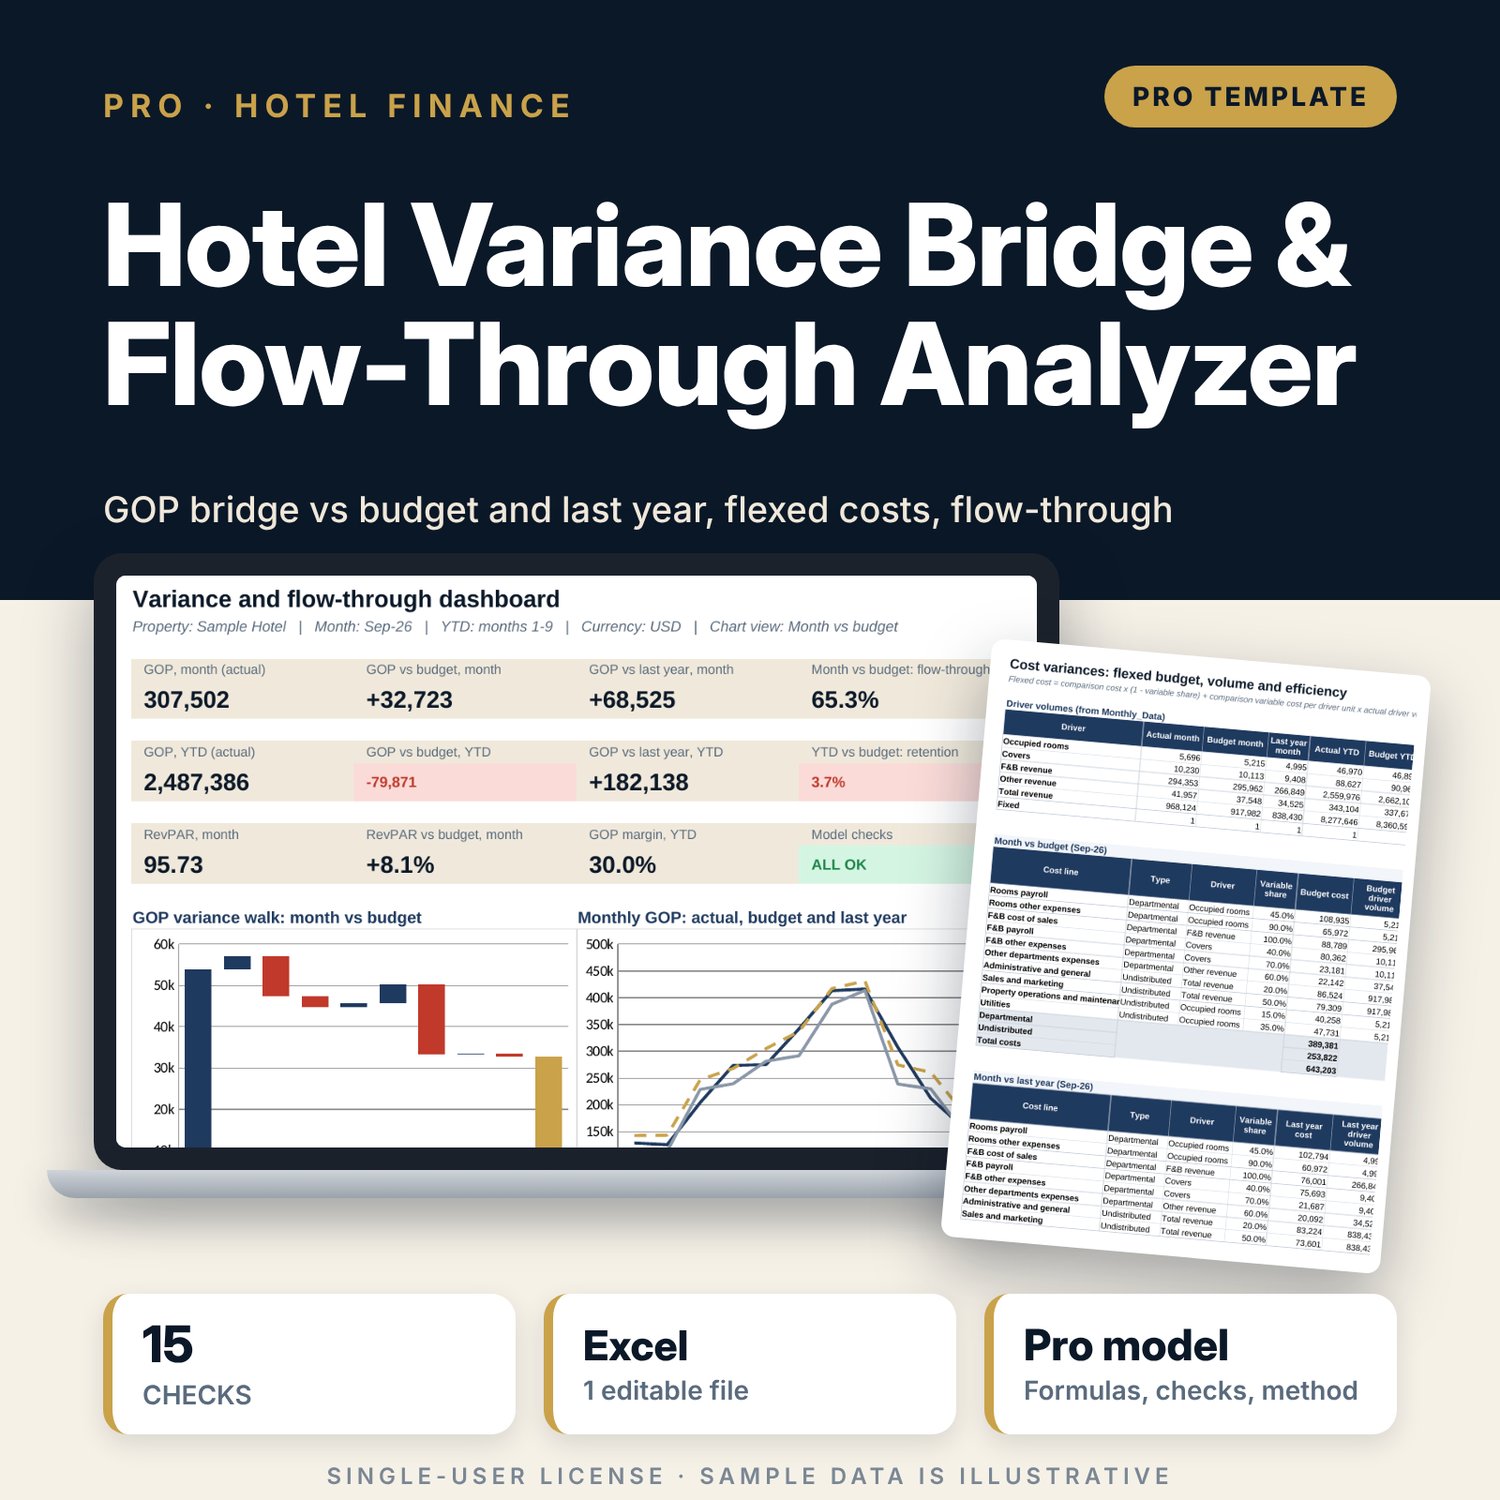
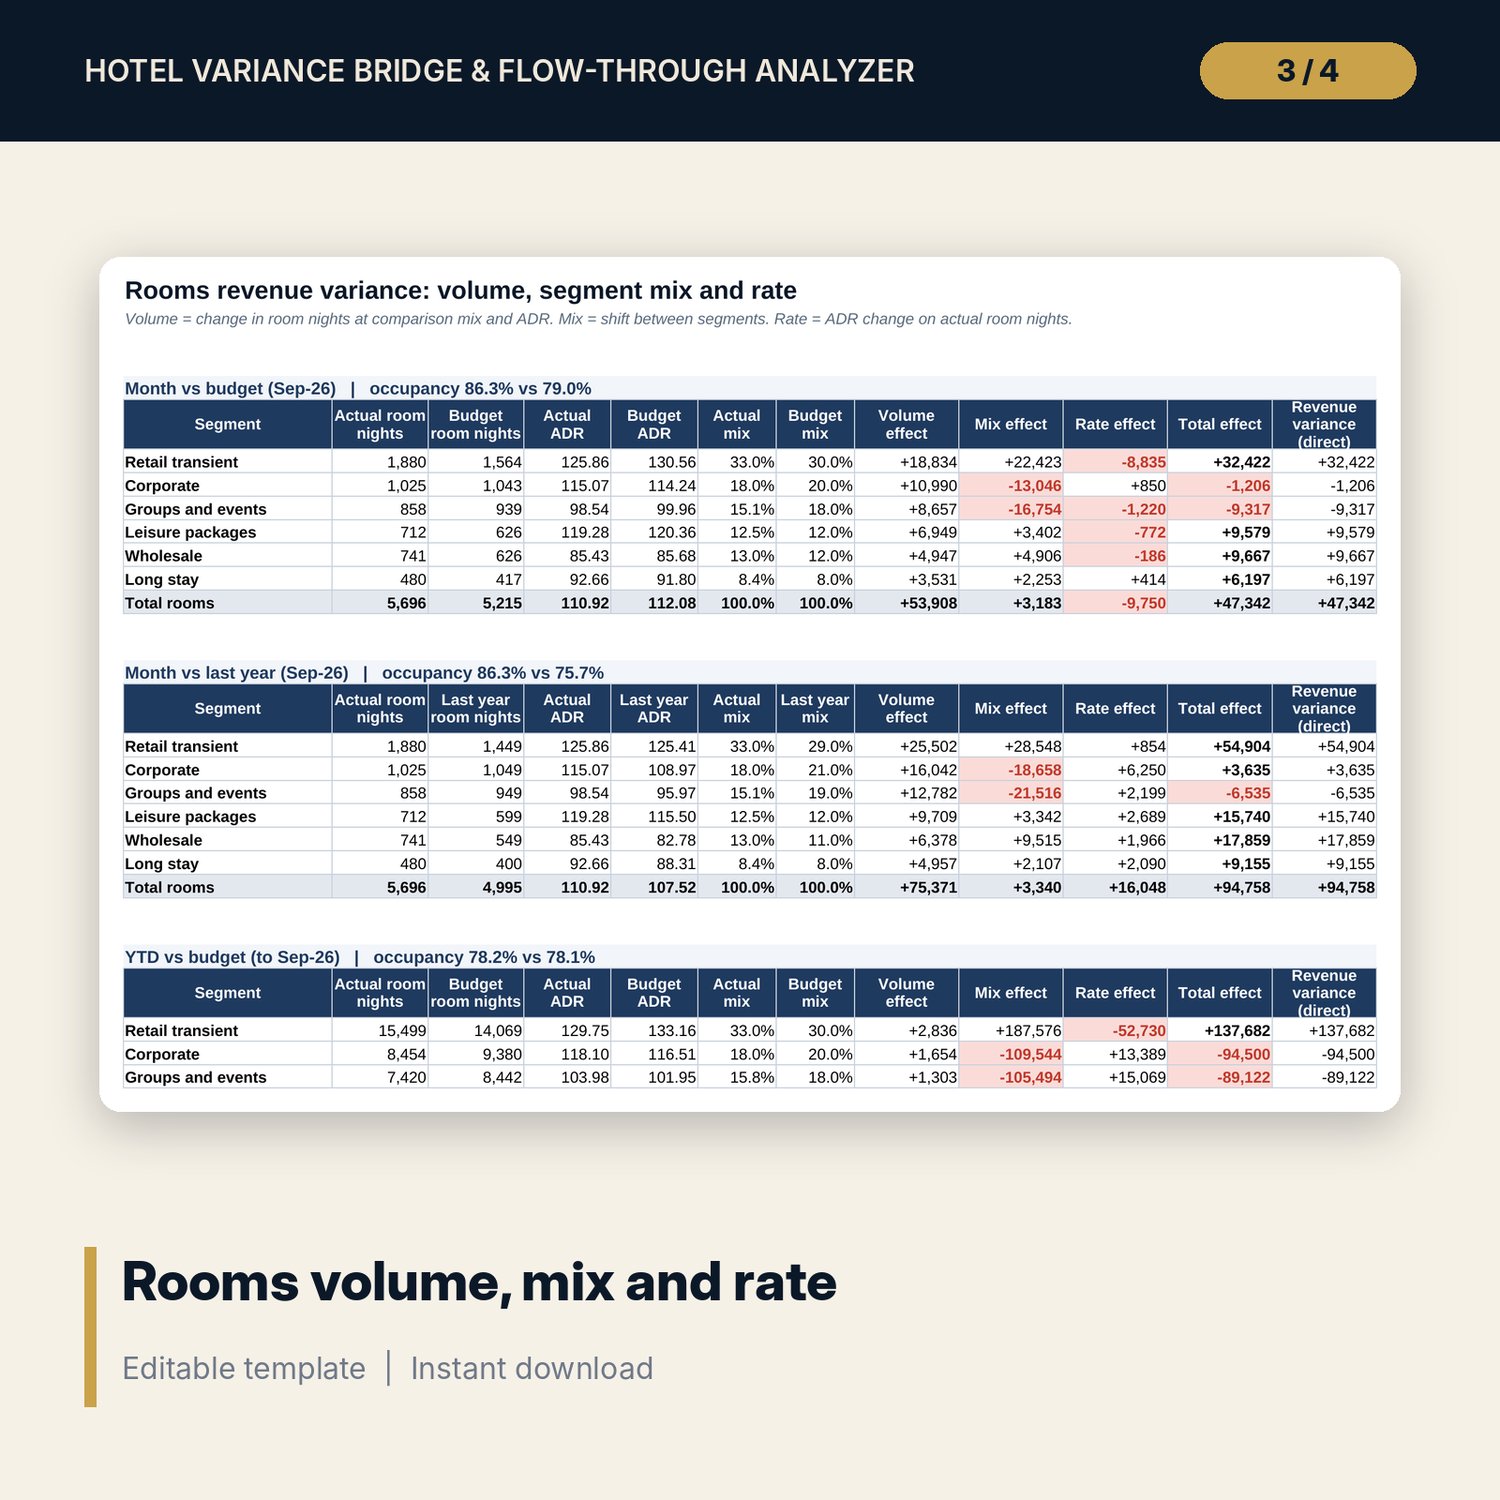
For financial controllers, general managers, revenue managers and owners' representatives who must explain the monthly result. The workbook takes 12 months of actual, budget and last-year data and calculates four views every time: the selected month and year to date, each against budget and against last year. Rooms revenue is split by segment into volume (room nights), segment mix and rate (ADR) effects that add exactly to the revenue variance. F&B is split by outlet into covers and average check effects. Each cost line is flexed on its own driver (occupied rooms, covers, F&B revenue, other revenue or total revenue) to separate the volume variance from the efficiency variance. A GOP bridge walks from comparison GOP to actual GOP and must close to zero, flow-through and retention are tested against your targets, and commentary prompts are built from the largest drivers.
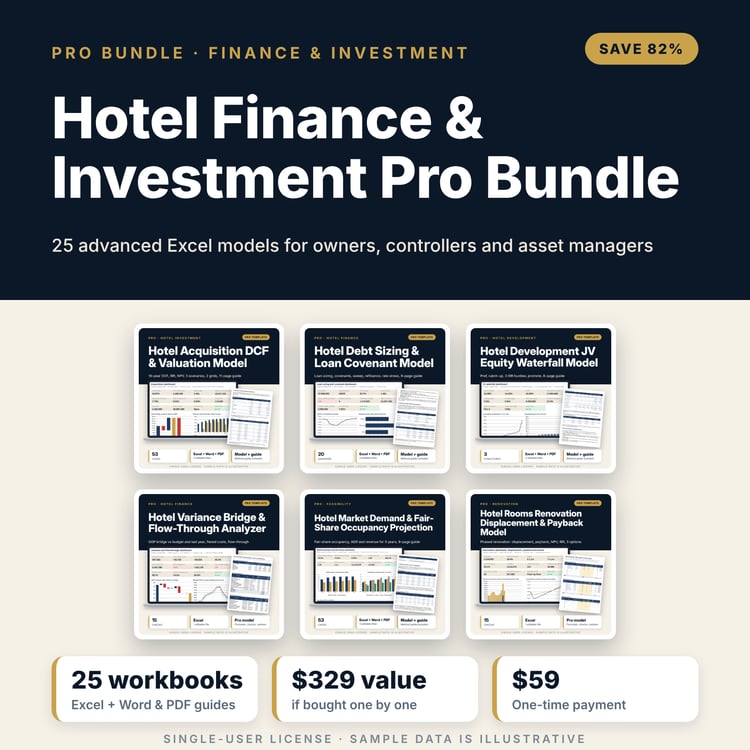
Save with a bundle: this workbook is also in the Hotel Finance & Investment Pro Bundle, 25 workbooks for $59 instead of $329. All 100 Pro workbooks are in the Pro Library for $119, and all 241 templates and workbooks are in the Ultimate Hospitality Library for $149.
What is inside
- Hotel_Variance_Bridge_Flow_Through_Analyzer.xlsx: 12 tabs, 2,806 formulas, 4 native charts, 8 drop-down and input rules, 15 integrity checks, a Method tab with 18 calculation notes.
- Monthly_Data: 12 months x 3 scenarios (1,152 sample input cells) for 6 segments, 4 outlets, other revenue and 10 cost lines, with totals, occupancy, ADR, RevPAR, GOP and GOP margin.
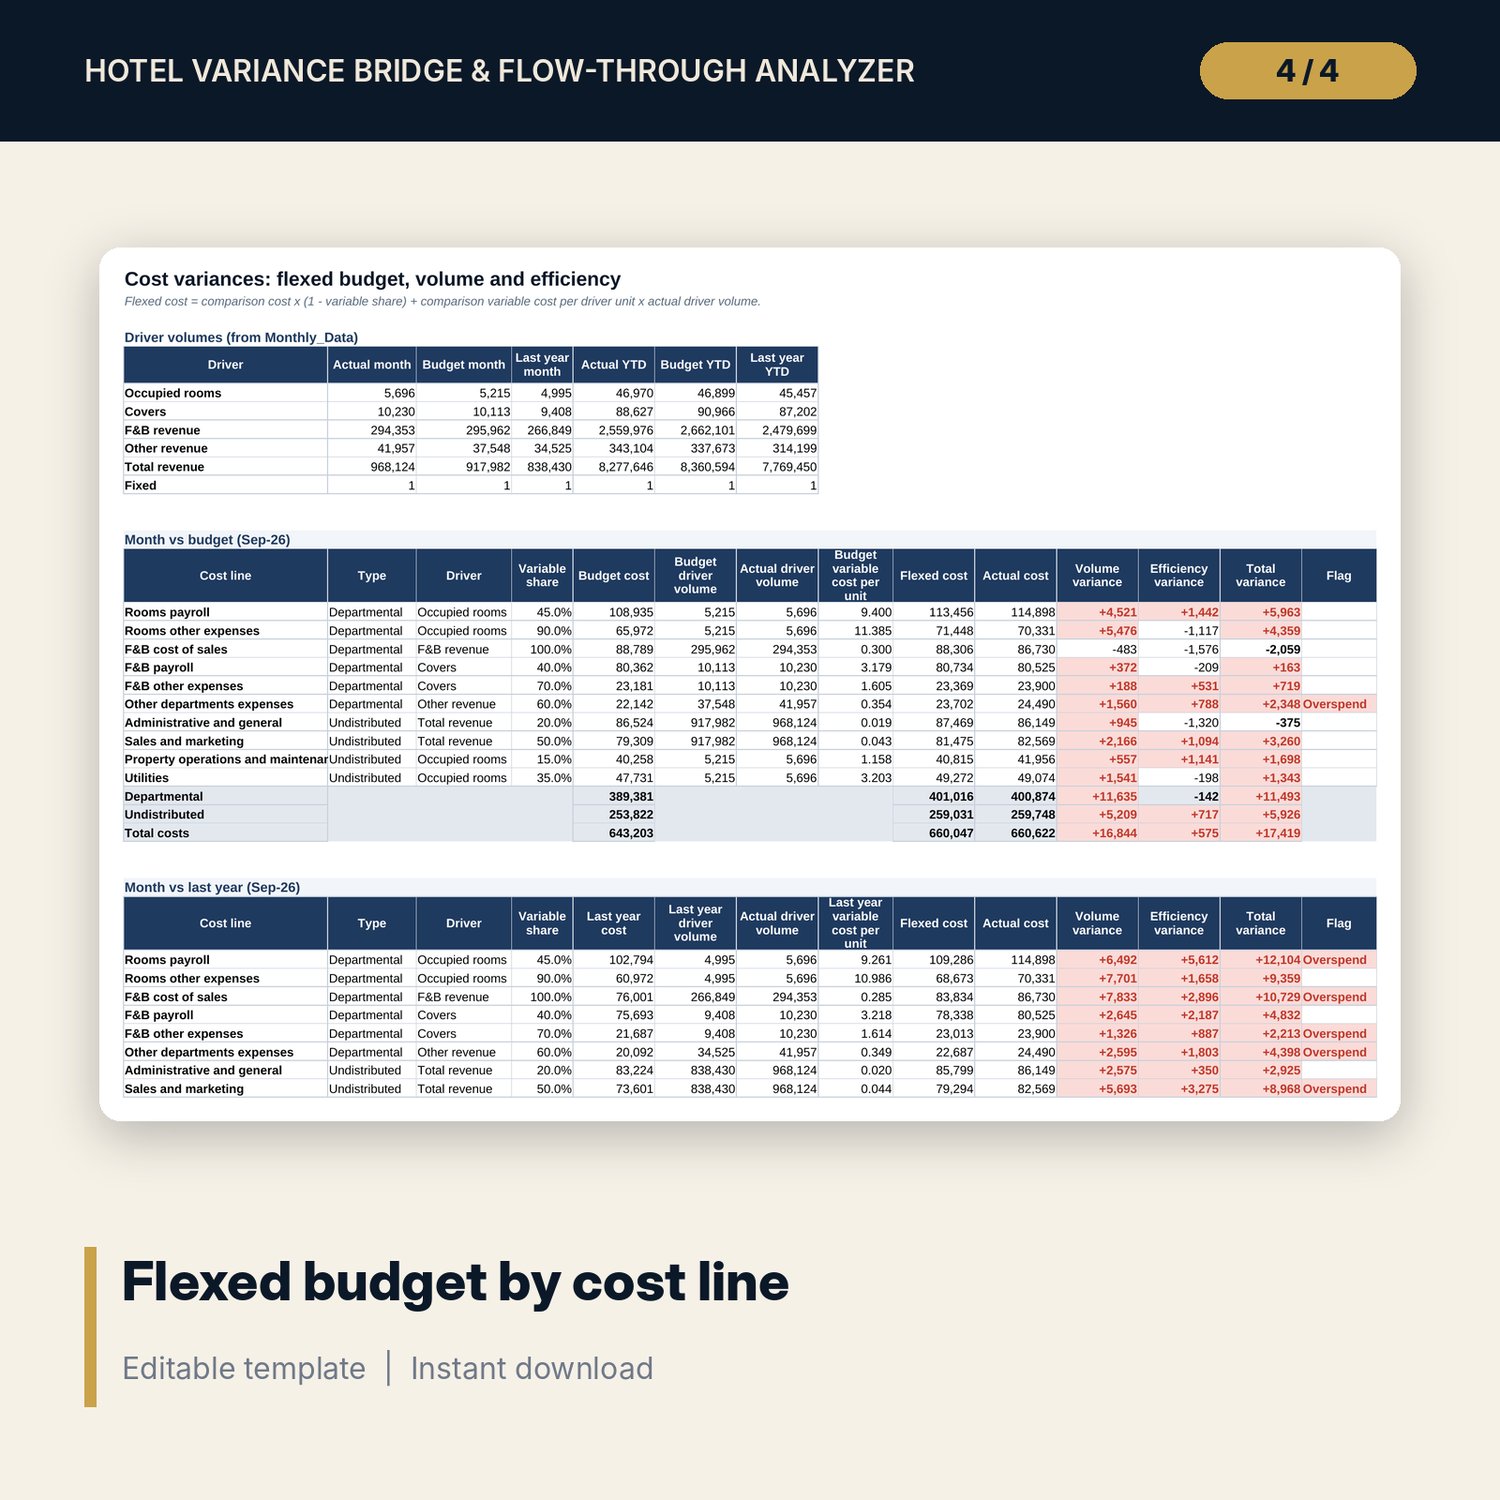
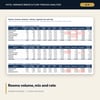
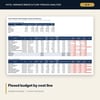
- Rooms_Bridge, FB_Bridge and Cost_Flex: volume, mix, rate, covers, check, flexed budget, volume and efficiency variances for 4 views, with flags.
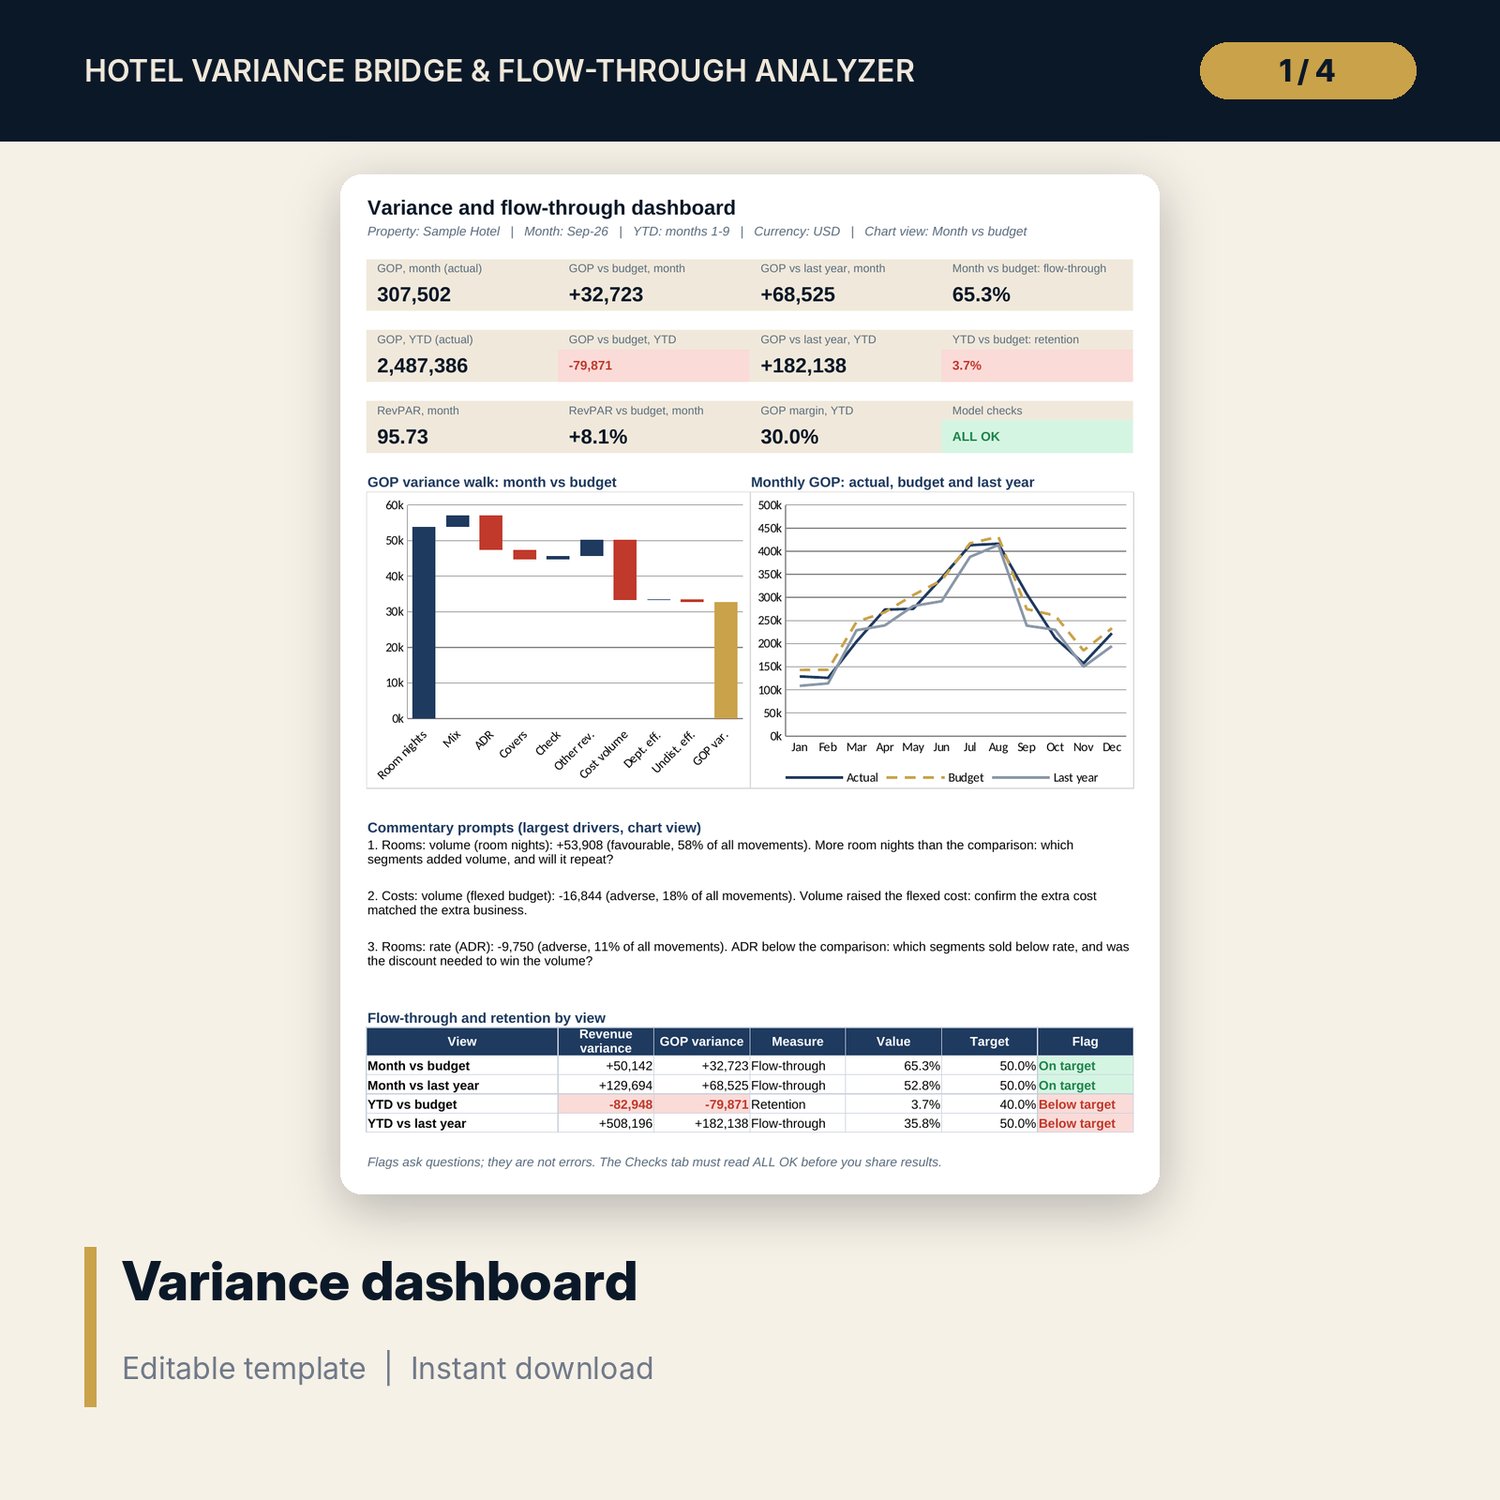
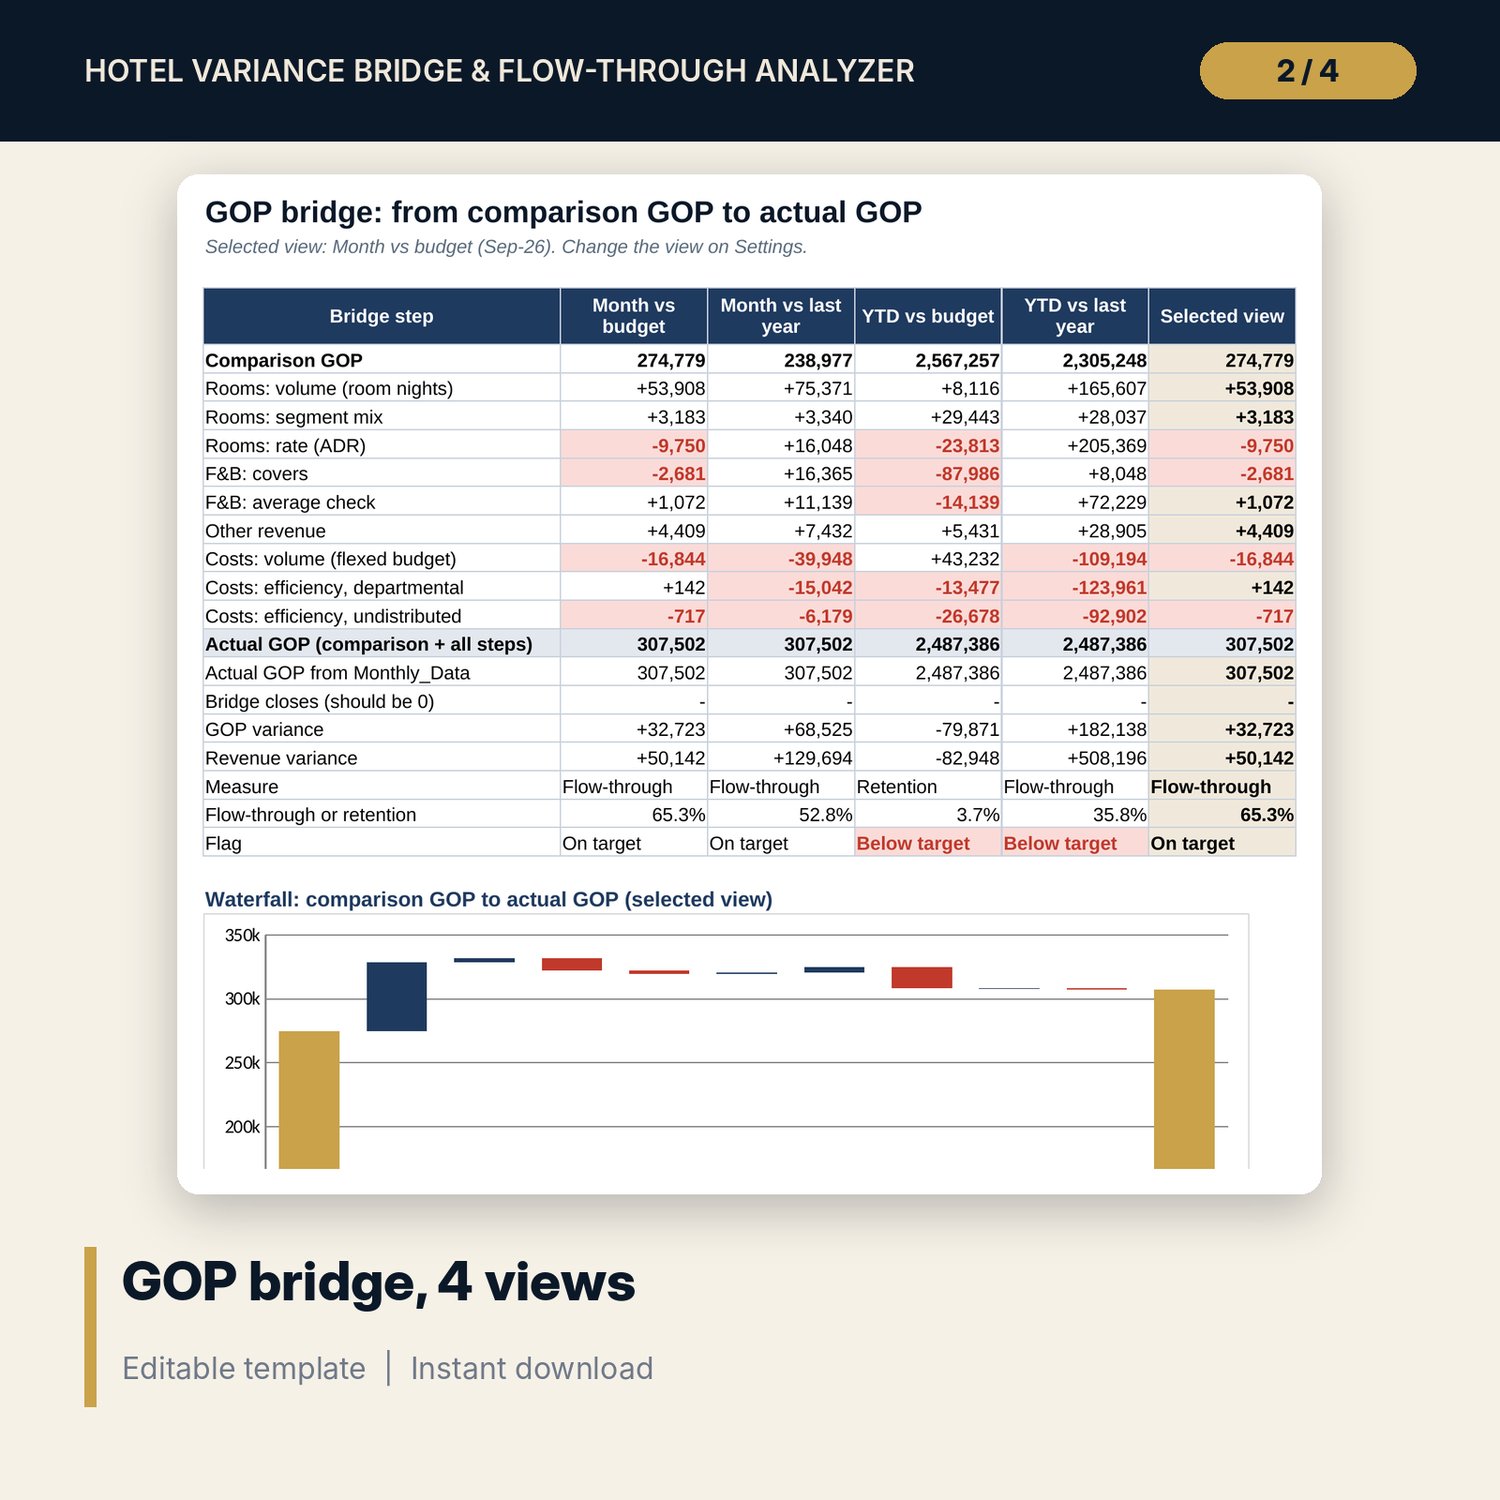
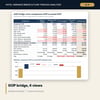
- GOP_Bridge: 9-step bridge for all 4 views, a closing check and a waterfall chart built from stacked columns.
- Flow_Through: flow-through or retention by view and for each of the 12 months against your targets.
- Commentary: bridge steps ranked by size, 3 driver prompts and 3 detail prompts (segment, outlet, cost line) from an editable question bank.
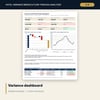
- Dashboard: 11 KPI tiles, a check tile, the GOP variance walk, monthly GOP chart, prompts and the flow-through table, printable on one page.
- README.txt and LICENSE-and-Terms.txt.
How it works
- Set the year start, the month to report, your targets, segment and outlet names on Settings.
- Give each cost line a type, a driver and a variable share on Settings.
- Paste actual, budget and last-year figures for each month on Monthly_Data.
- Read the bridges and the flow-through flags, then copy the prompts into your month-end commentary.
- Confirm the Checks tab shows ALL OK before you share the file.
Details
- Format: one XLSX workbook, English.
- Software: Excel 2016 or later, or LibreOffice Calc. No macros, no add-ins, no pivot tables.
- Monthly data in any currency, 6 segments, 4 outlets, 10 cost lines.
- Delivery: instant download.
Good to know
- Sample data is illustrative and does not describe any hotel. Replace it with your own figures.
- Not accounting or financial advice. The variable share of each cost line is your judgement; review it once a year.
- Segment and outlet names are editable; the number of segments (6), outlets (4) and cost lines (10) is fixed.
- Single-user license.
FAQ
Do the rooms effects add up to the actual revenue variance?
Yes. Volume, mix and rate add exactly to actual minus comparison revenue for every segment, and a check confirms it for all four views.
How is the flexed budget built?
Each cost line keeps its fixed part and moves its variable part with the chosen driver. For rooms costs that is the variable cost per occupied room times actual occupied rooms.
What is the difference between flow-through and retention?
Flow-through applies when revenue is above the comparison: the share of the extra revenue that reached GOP. Retention applies when revenue is below: the share of the lost revenue that cost savings kept out of GOP.
Can I report a month other than the last one?
Yes. Pick any month from 1 to 12 on Settings. Month and YTD results, bridges and prompts follow.
Does it write the commentary for me?
It writes prompts: the largest drivers with their values and a question for each. The explanation still comes from the department heads.