

Hotel Market Demand & Fair-Share Occupancy Projection: fair-share hotel feasibility model with a 5-year occupancy forecast
Full description
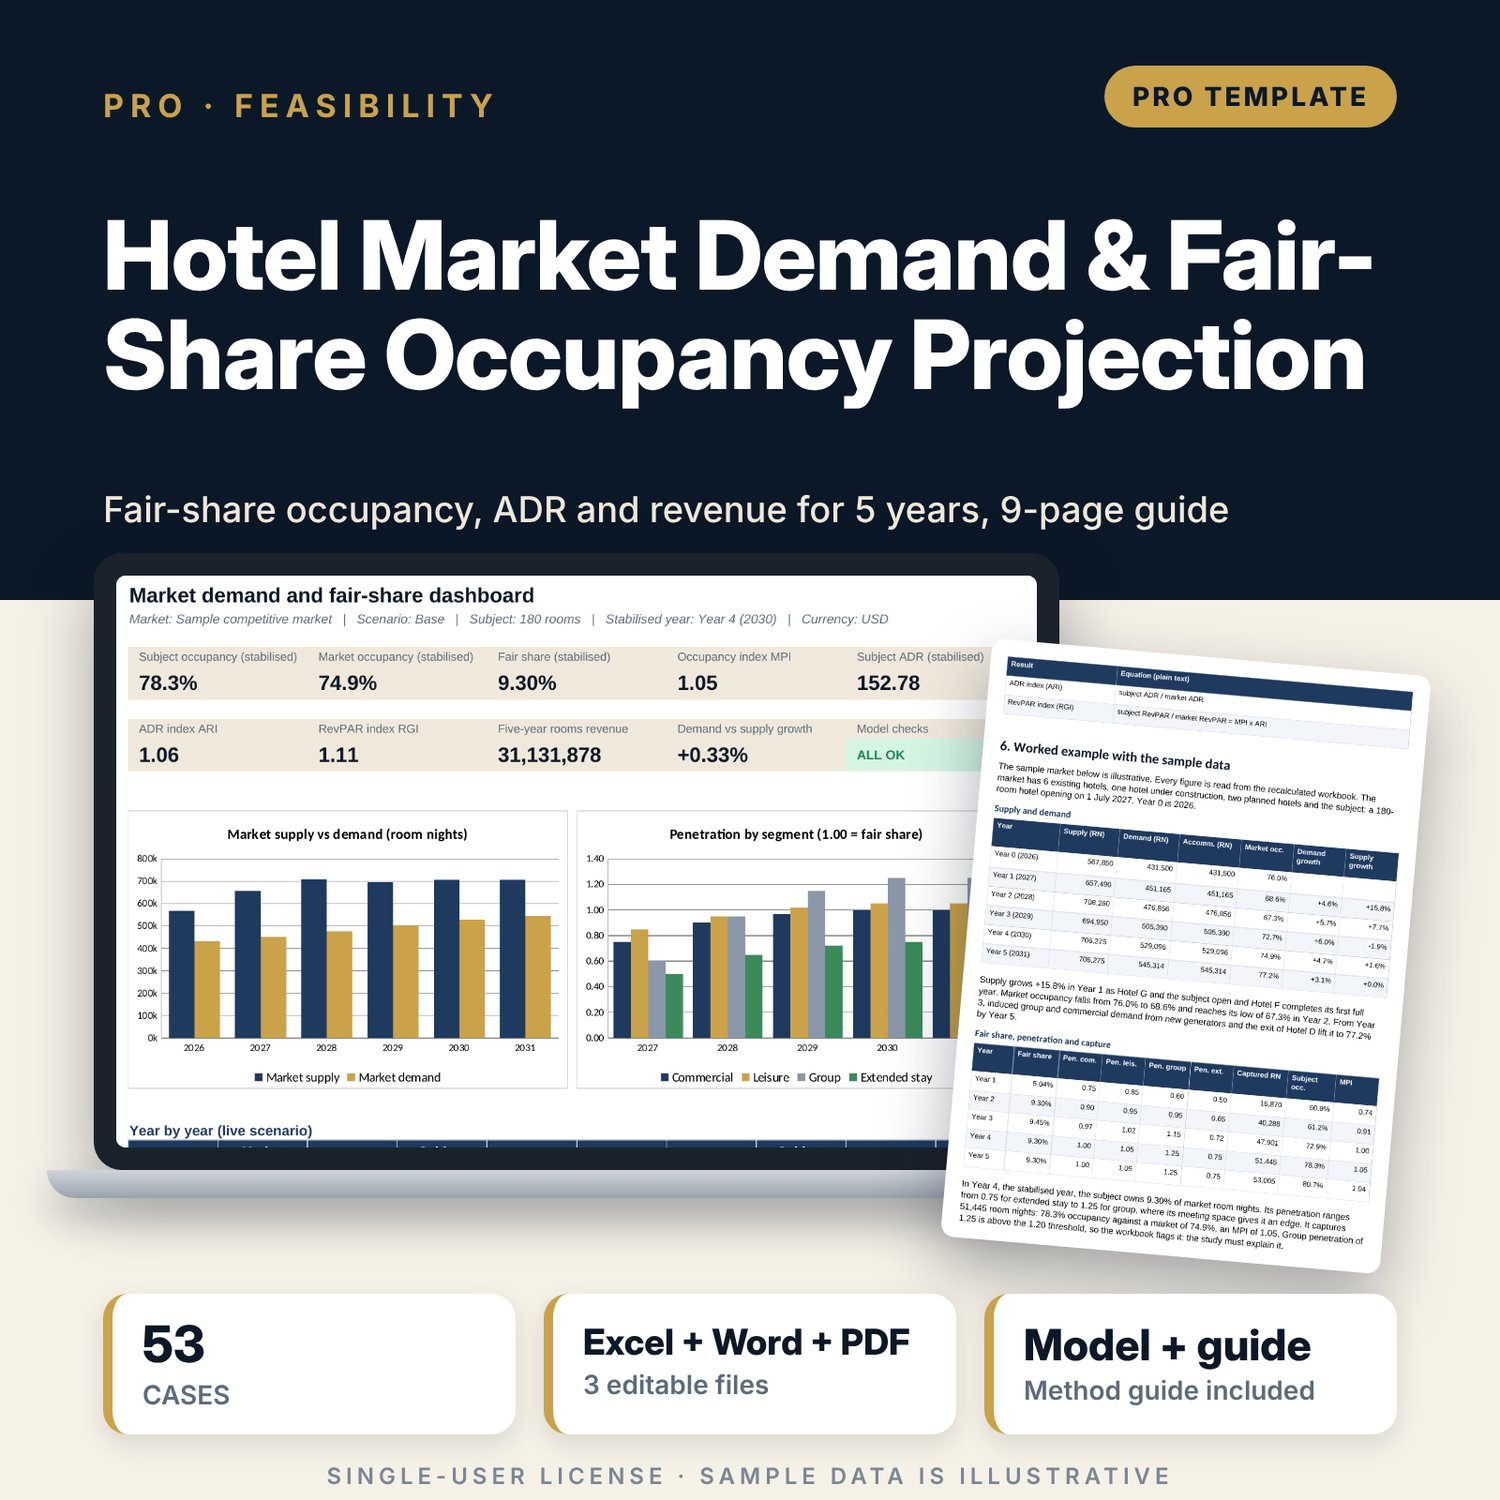
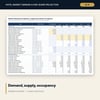
For developers, owners, asset managers, general managers and revenue managers who need the market side of a hotel feasibility study. You enter base-year room-night demand for four segments (commercial, leisure, group, extended stay), growth by segment and year, induced demand from new generators, every competitive hotel with rooms, opening and closing dates and an inclusion % for planned projects, and penetration factors by segment and year for the proposed hotel. The workbook phases supply by month, caps demand at a maximum market occupancy, calculates fair share, captured room nights with a capacity cap, market and subject occupancy, ADR positioning against the market, rooms revenue and the MPI, ARI and RGI indices for 5 years. Base, Upside and Downside scenarios and two 5 x 5 sensitivity grids come from a one-case-per-row engine that re-runs the model 53 times without data tables or macros.
Save with a bundle: this workbook is also in the Hotel Finance & Investment Pro Bundle, 25 workbooks for $59 instead of $329. All 100 Pro workbooks are in the Pro Library for $119, and all 241 templates and workbooks are in the Ultimate Hospitality Library for $149.
What is inside
- Hotel_Market_Demand_Fair_Share_Model.xlsx: 12 tabs, 7,516 formulas, 3 native charts, 15 integrity checks, a Method tab with 18 calculation notes.
- Sample market (illustrative): 10 hotels including the subject (15 slots), 72 months of phased supply, 4 segments over Year 0 to Year 5.
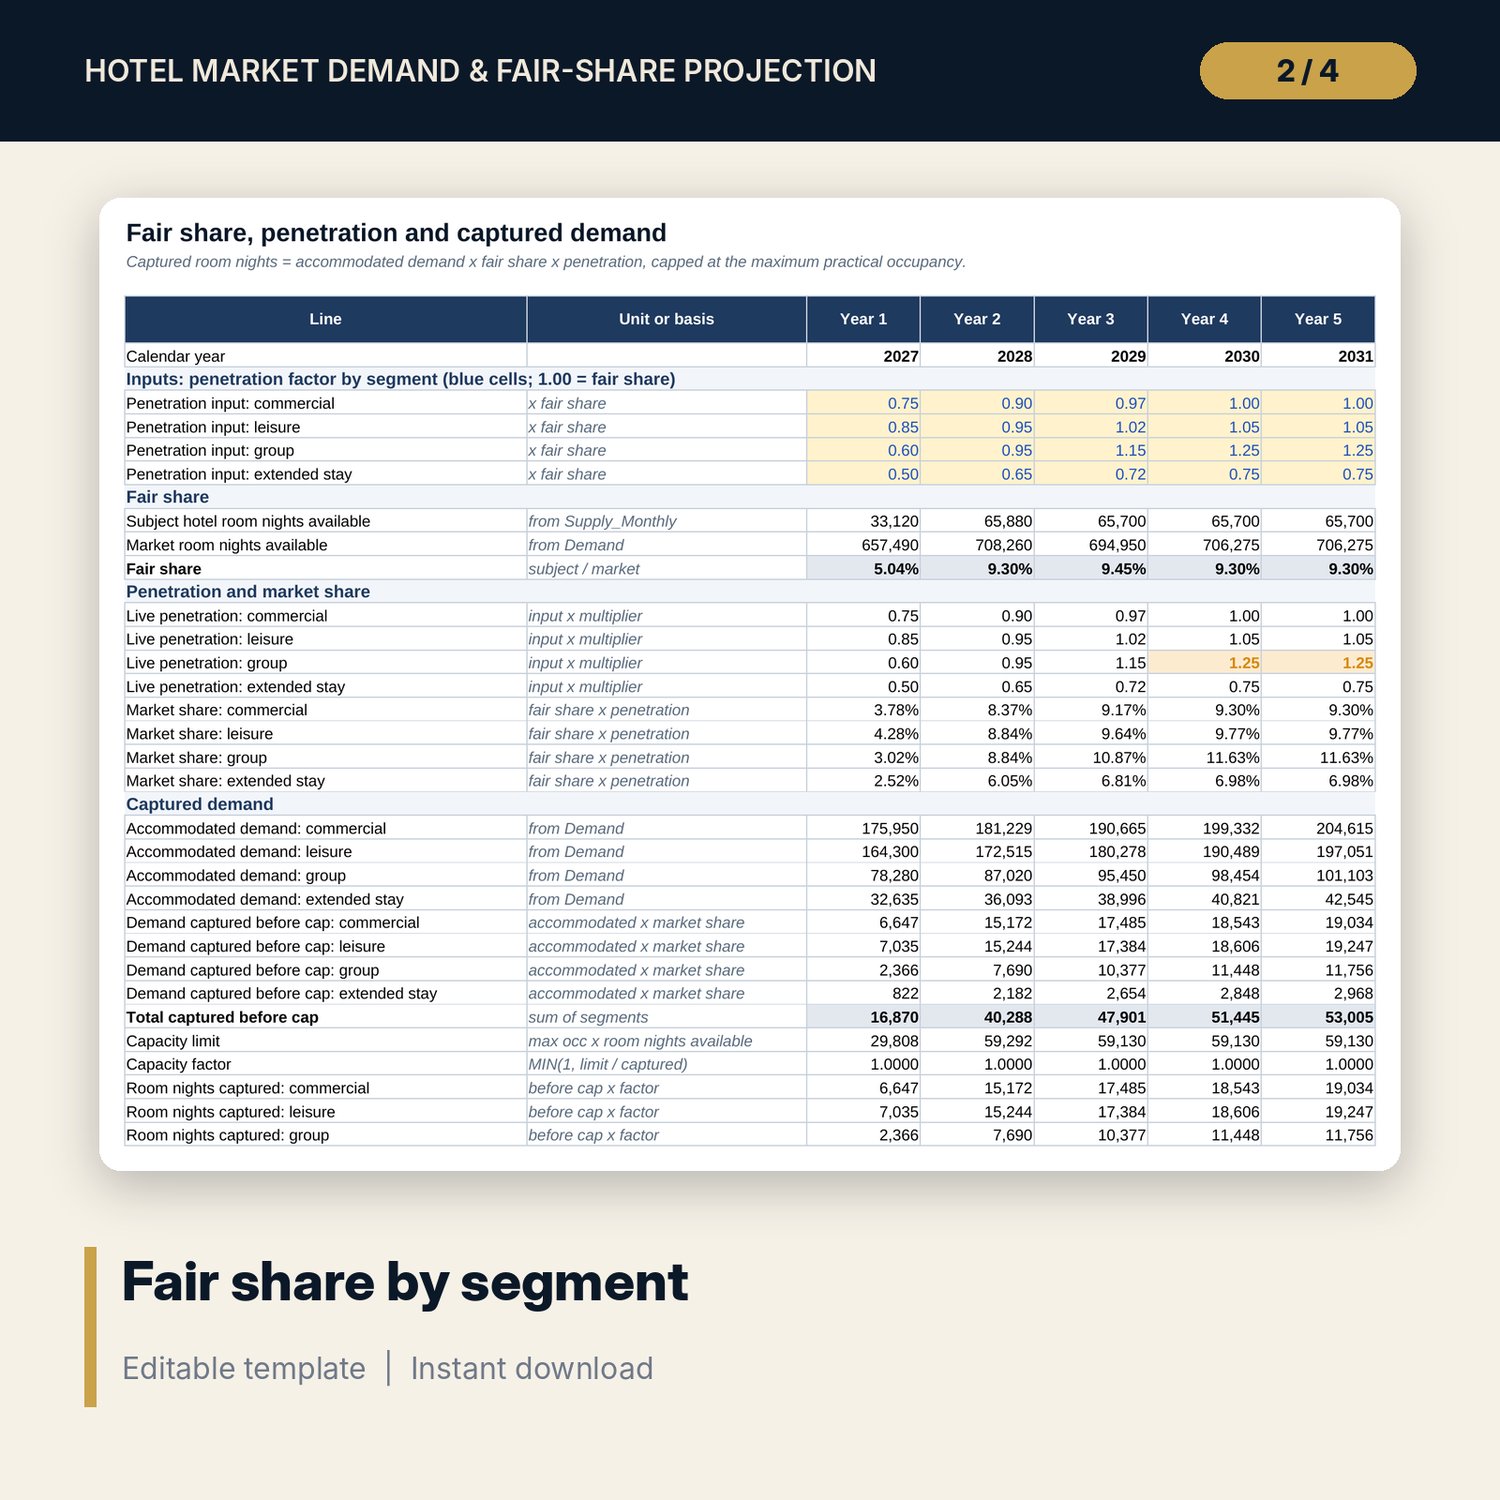
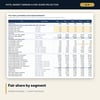
- Fair-share engine: fair share, penetration, market share, captured room nights, capacity cap and competitor occupancy for each segment and year.
- Projection: subject ADR by segment, rooms revenue, ADR, RevPAR, MPI, ARI, RGI and revenue mix for Years 1 to 5.
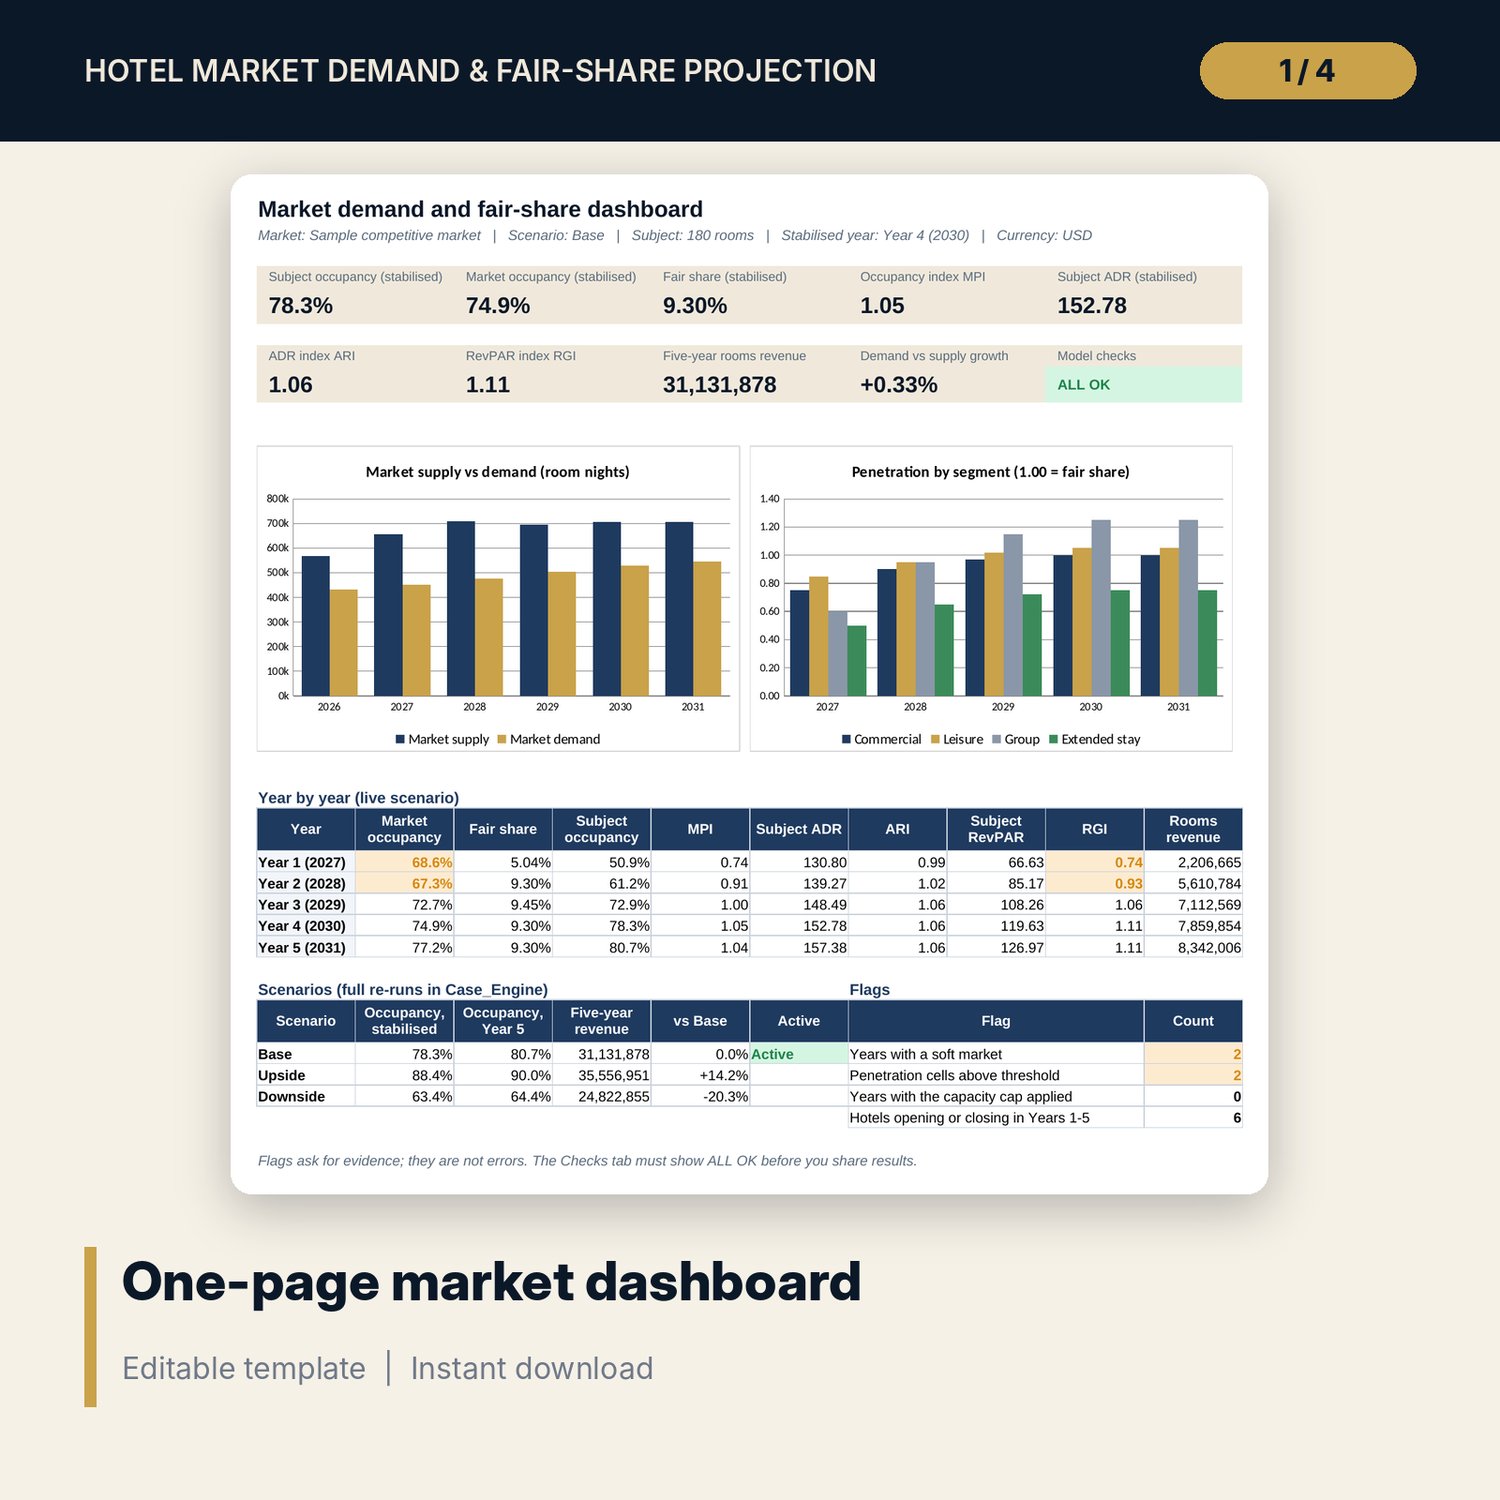
- Sensitivity: stabilised occupancy by demand growth x penetration and five-year revenue by new supply x ADR index (25 cases each), plus 3 scenarios side by side.
- Dashboard: 9 KPI tiles, a check tile, a supply vs demand chart, a penetration chart, a year table and a flag summary on one page.
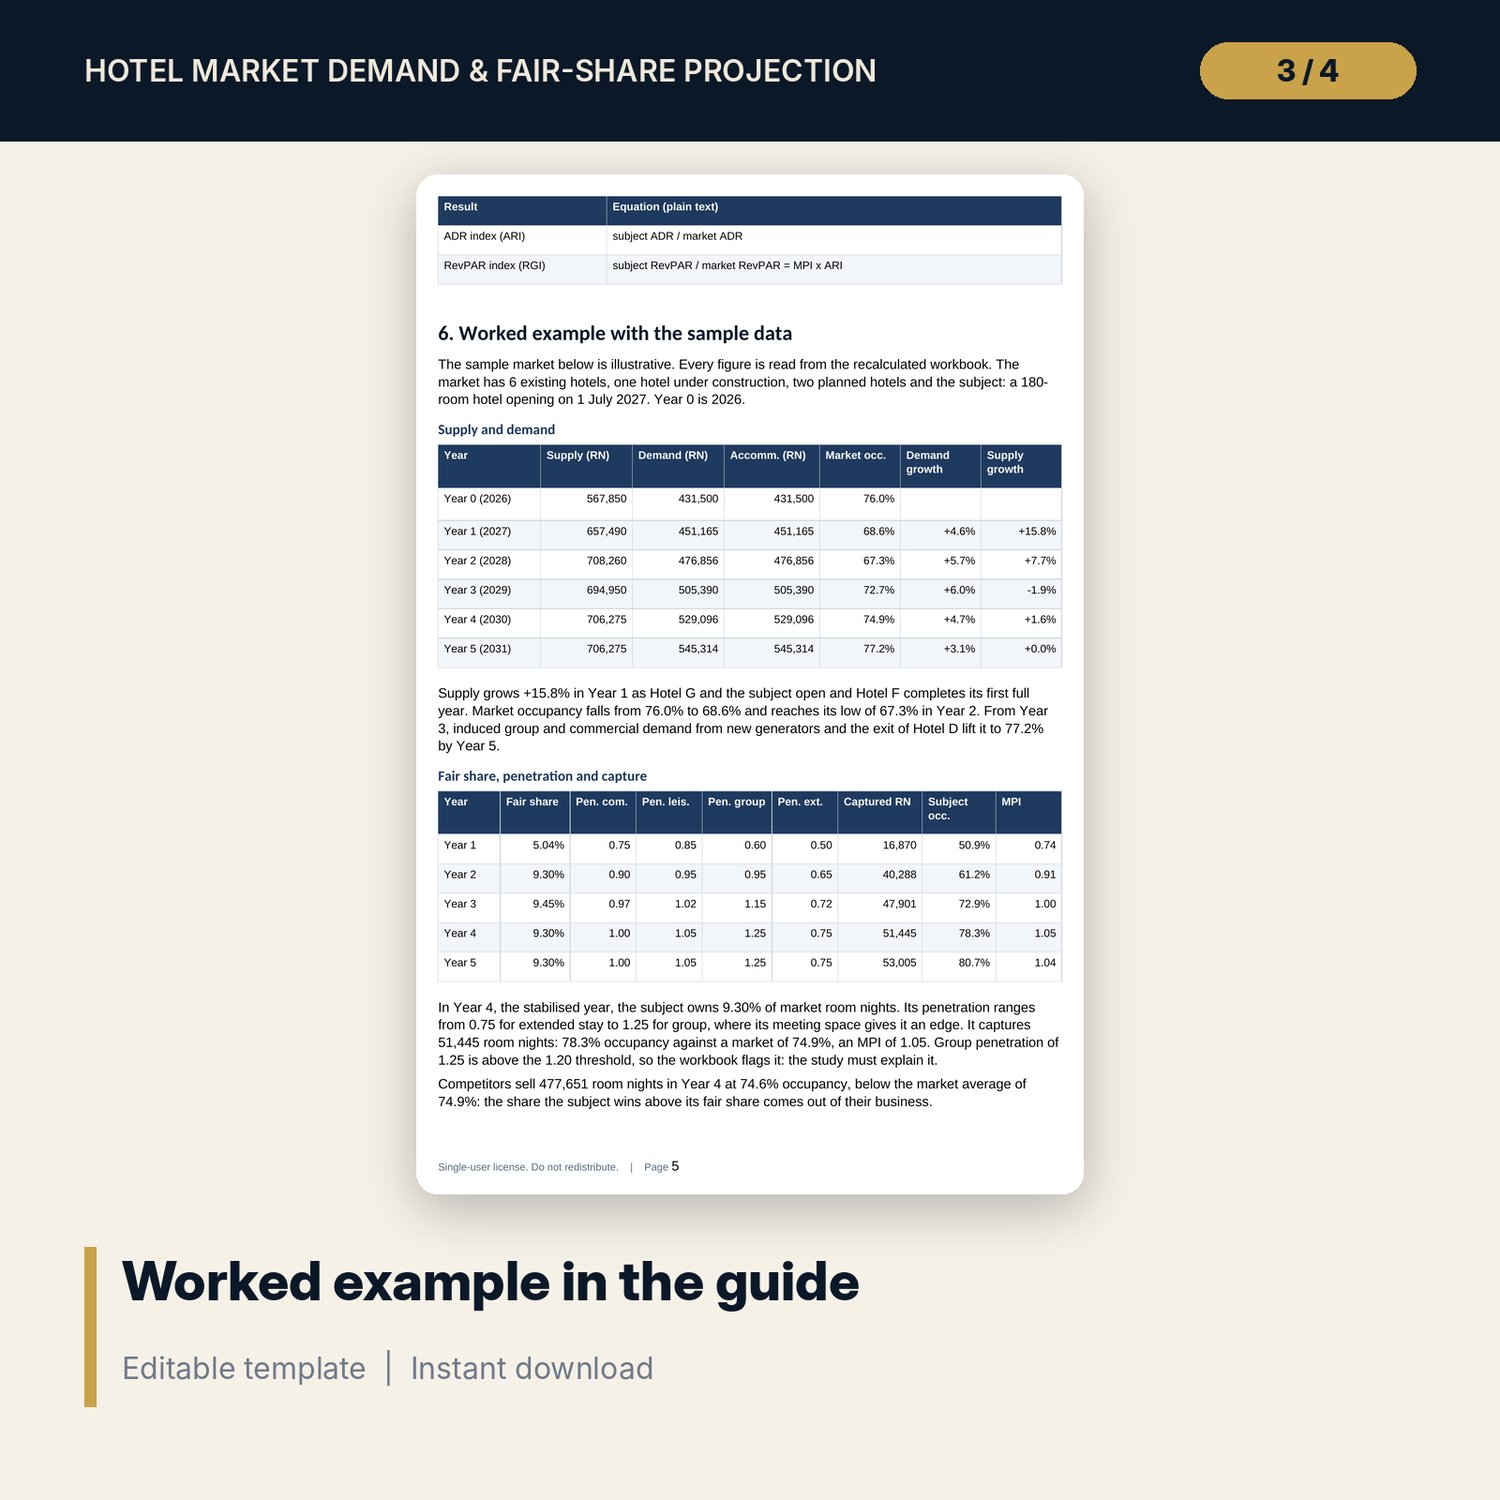
- Hotel_Market_Demand_Fair_Share_Guide.docx and Hotel_Market_Demand_Fair_Share_Guide.pdf: 9-page guide on the fair-share method, how to defend each assumption, the equations, a worked example on the sample results, common mistakes, limitations, a review checklist and a glossary.
- README.txt and LICENSE-and-Terms.txt.
How it works
- Enter the subject hotel, capacity limits and ADR index by segment on Assumptions.
- List the competitive hotels with rooms, type, dates and inclusion % on Supply.
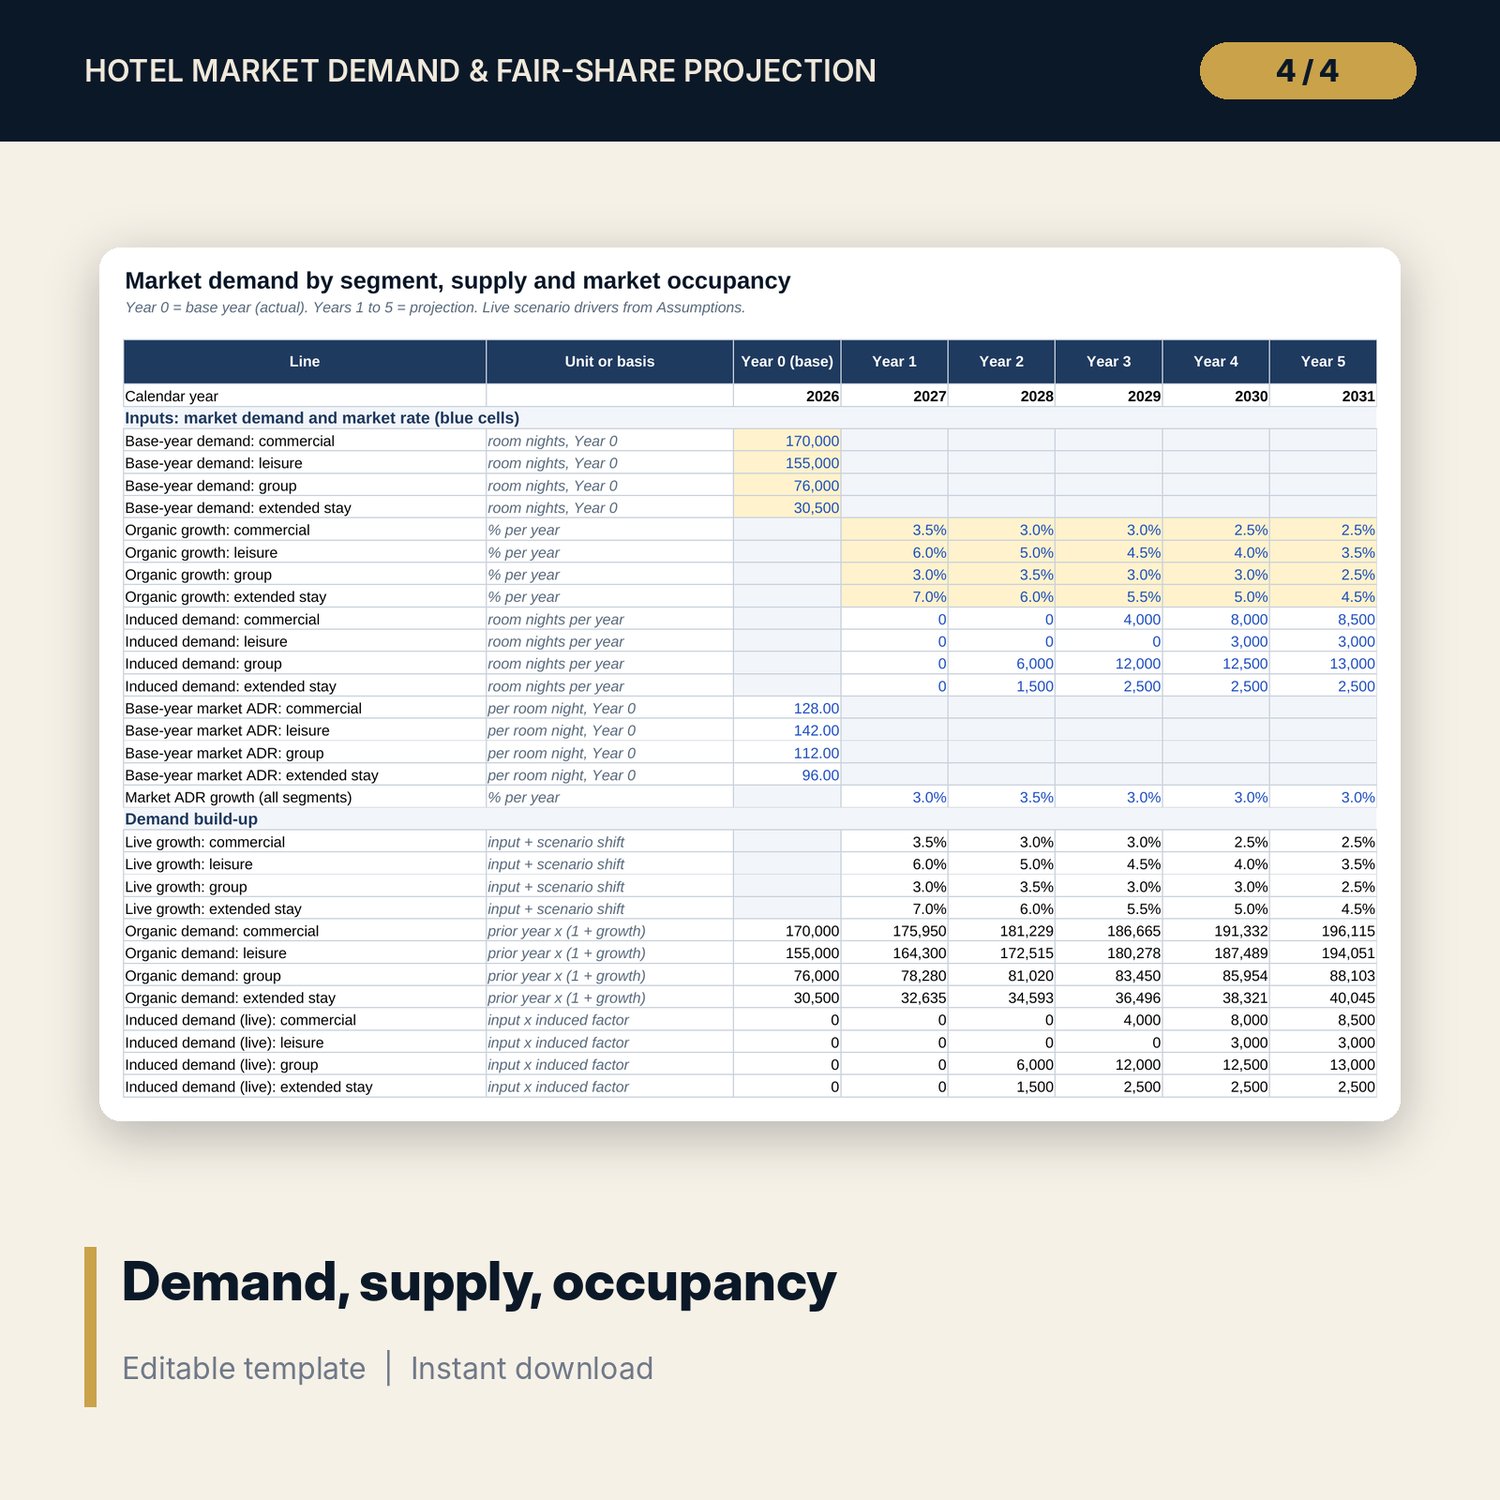
- Enter base-year demand, growth, induced demand and market ADR on Demand, and penetration factors on Fair_Share.
- Read occupancy, ADR, rooms revenue and the indices on Projection and the Dashboard.
- Stress the result on Sensitivity, switch scenarios, and confirm the Checks tab shows ALL OK.
Details
- Formats: XLSX workbook, DOCX guide, PDF guide.
- Language: English.
- Software: Excel 2016 or later, or LibreOffice Calc. No macros, no data tables, no add-ins.
- Annual demand model with monthly supply phasing, any currency.
- Delivery: instant download.
Good to know
- Sample data is illustrative and does not describe any market. Replace it with your own research.
- Not investment or financial advice. Penetration factors are your judgement; the workbook tests them but cannot prove them.
- Planned hotels and opening dates change: verify local planning records and requirements.
- Single-user license.
FAQ
What is the fair-share method?
Fair share is the subject hotel's share of market room nights. Penetration compares the share it actually captures with that fair share. Captured demand = market demand x fair share x penetration.
How does it handle hotels that open mid-year?
Every hotel is phased by month from its opening and closing dates, so a hotel that opens in October adds three months of rooms in its first year.
Can I weight planned hotels that may never open?
Yes. Each hotel has an inclusion %. The new supply factor in the scenarios and in grid 2 scales the weighted pipeline further.
Does it cover profit or investment returns?
No. It covers the market side: demand, occupancy, ADR and rooms revenue. Feed its results into your operating and investment model.
How do I know the formulas are right?
The Checks tab runs 15 tests, including supply calculated two ways and a full re-run of the live case that must match the main results.