

The Spoonie's Health Tracker: Daily Symptom Log Spreadsheet
Chronic Illness Health & Symptom Tracker Spreadsheet
Track your patterns. Understand your body. Finally have the data that tells your story.
You know this feeling.
You sit down at a doctor's appointment, and your mind goes blank. How has your pain been? When did your fatigue get worse? What changed last month?
You've been living it every single day — and you can't remember any of it.
Or maybe you can remember. But it's scattered across your phone notes, a half-filled diary, a few voice memos, and a text you sent yourself at 2 am during a bad night.
The Spoonie's Health Tracker was built to fix that.
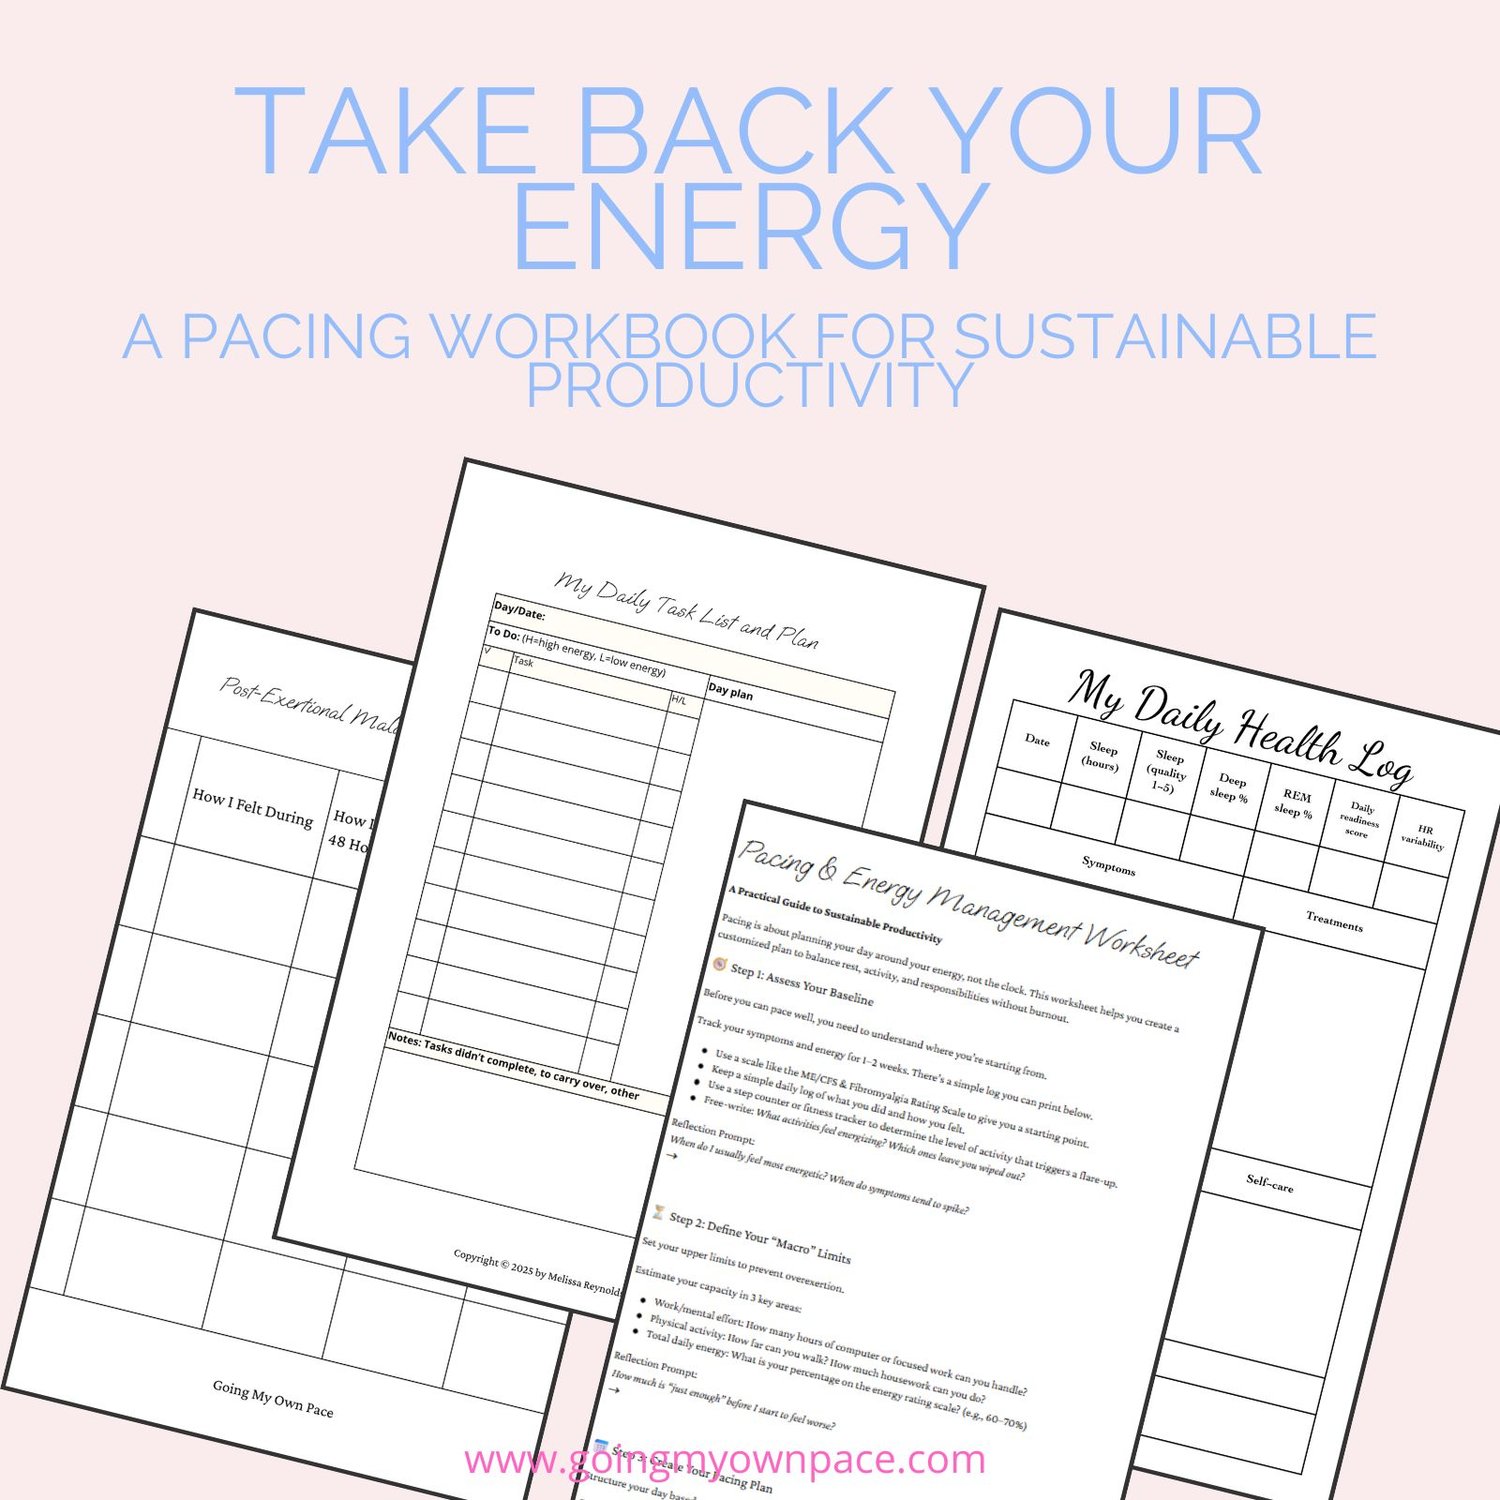
What it is
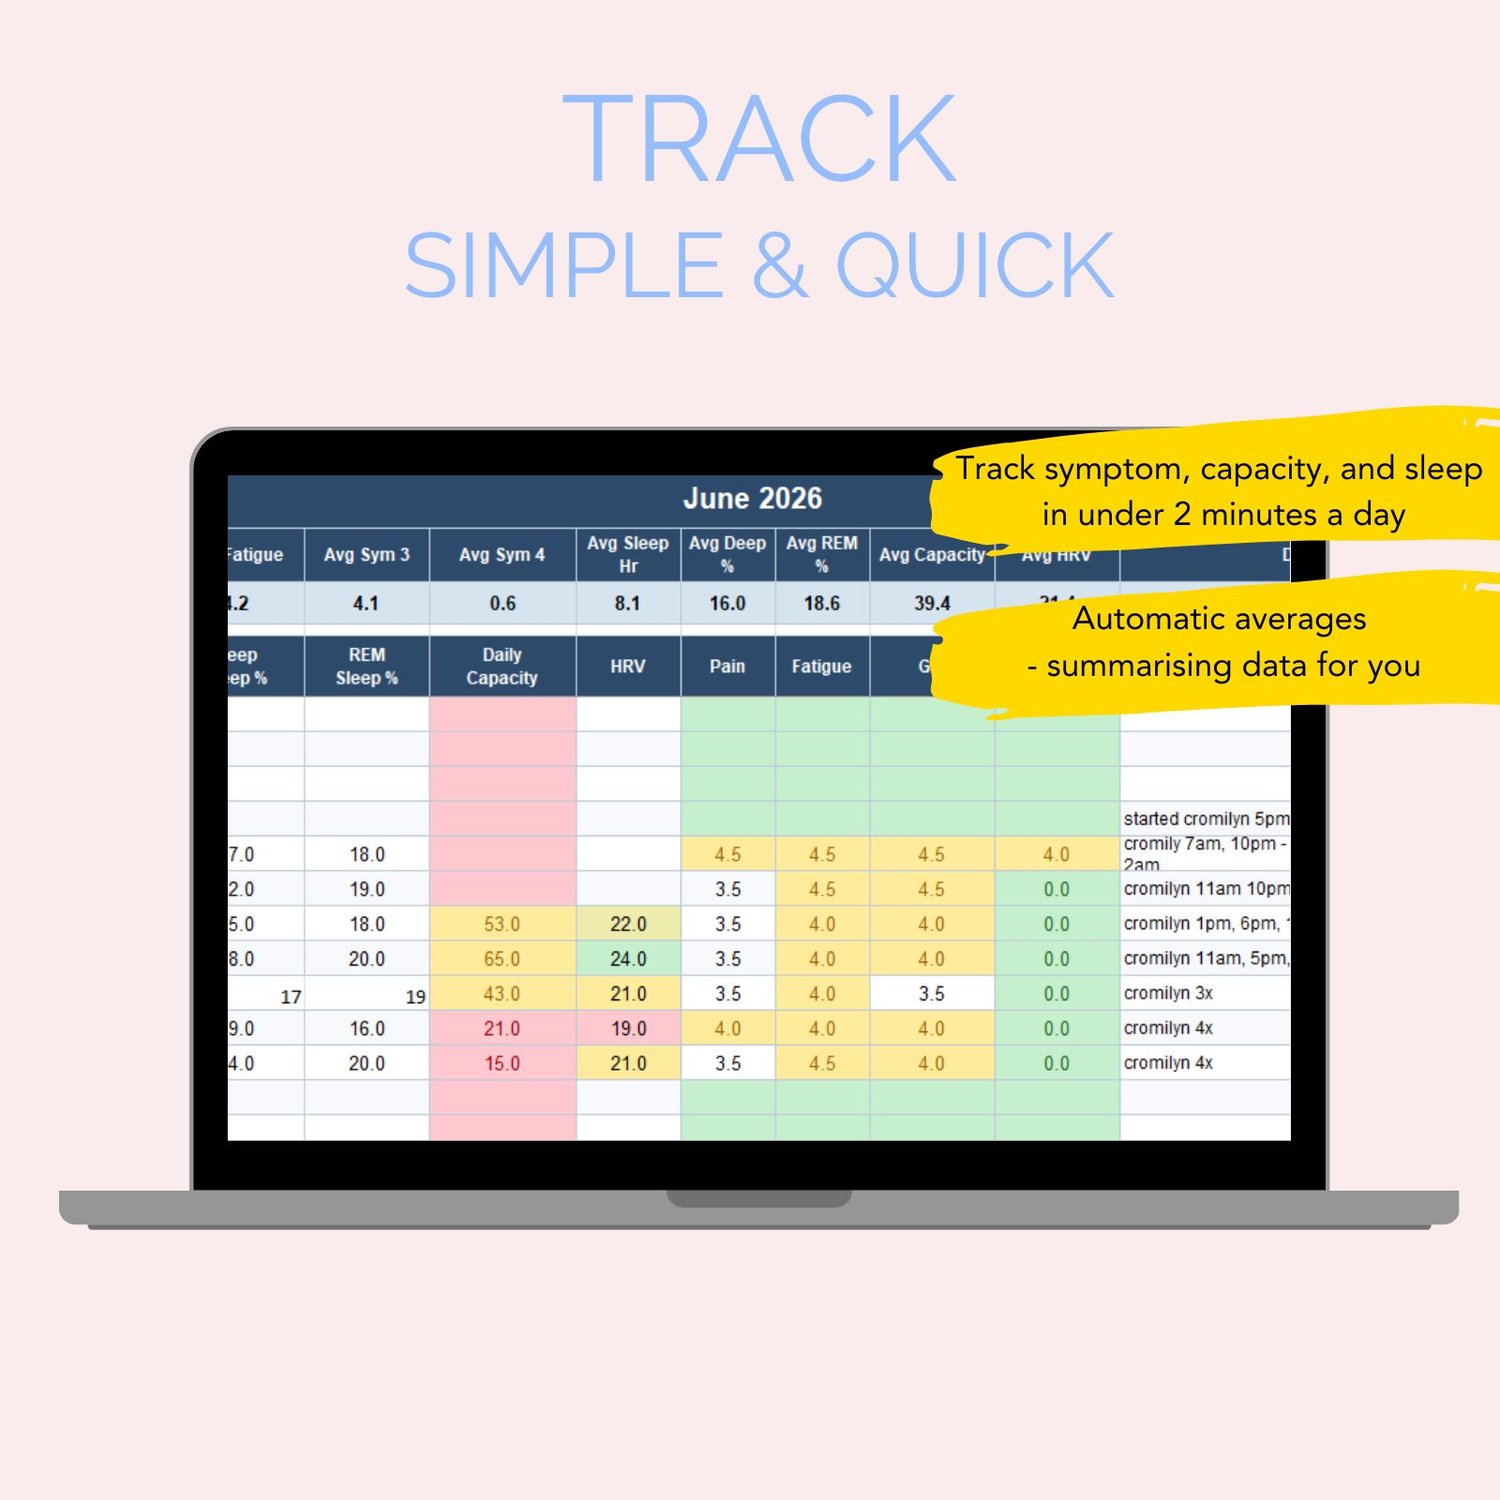
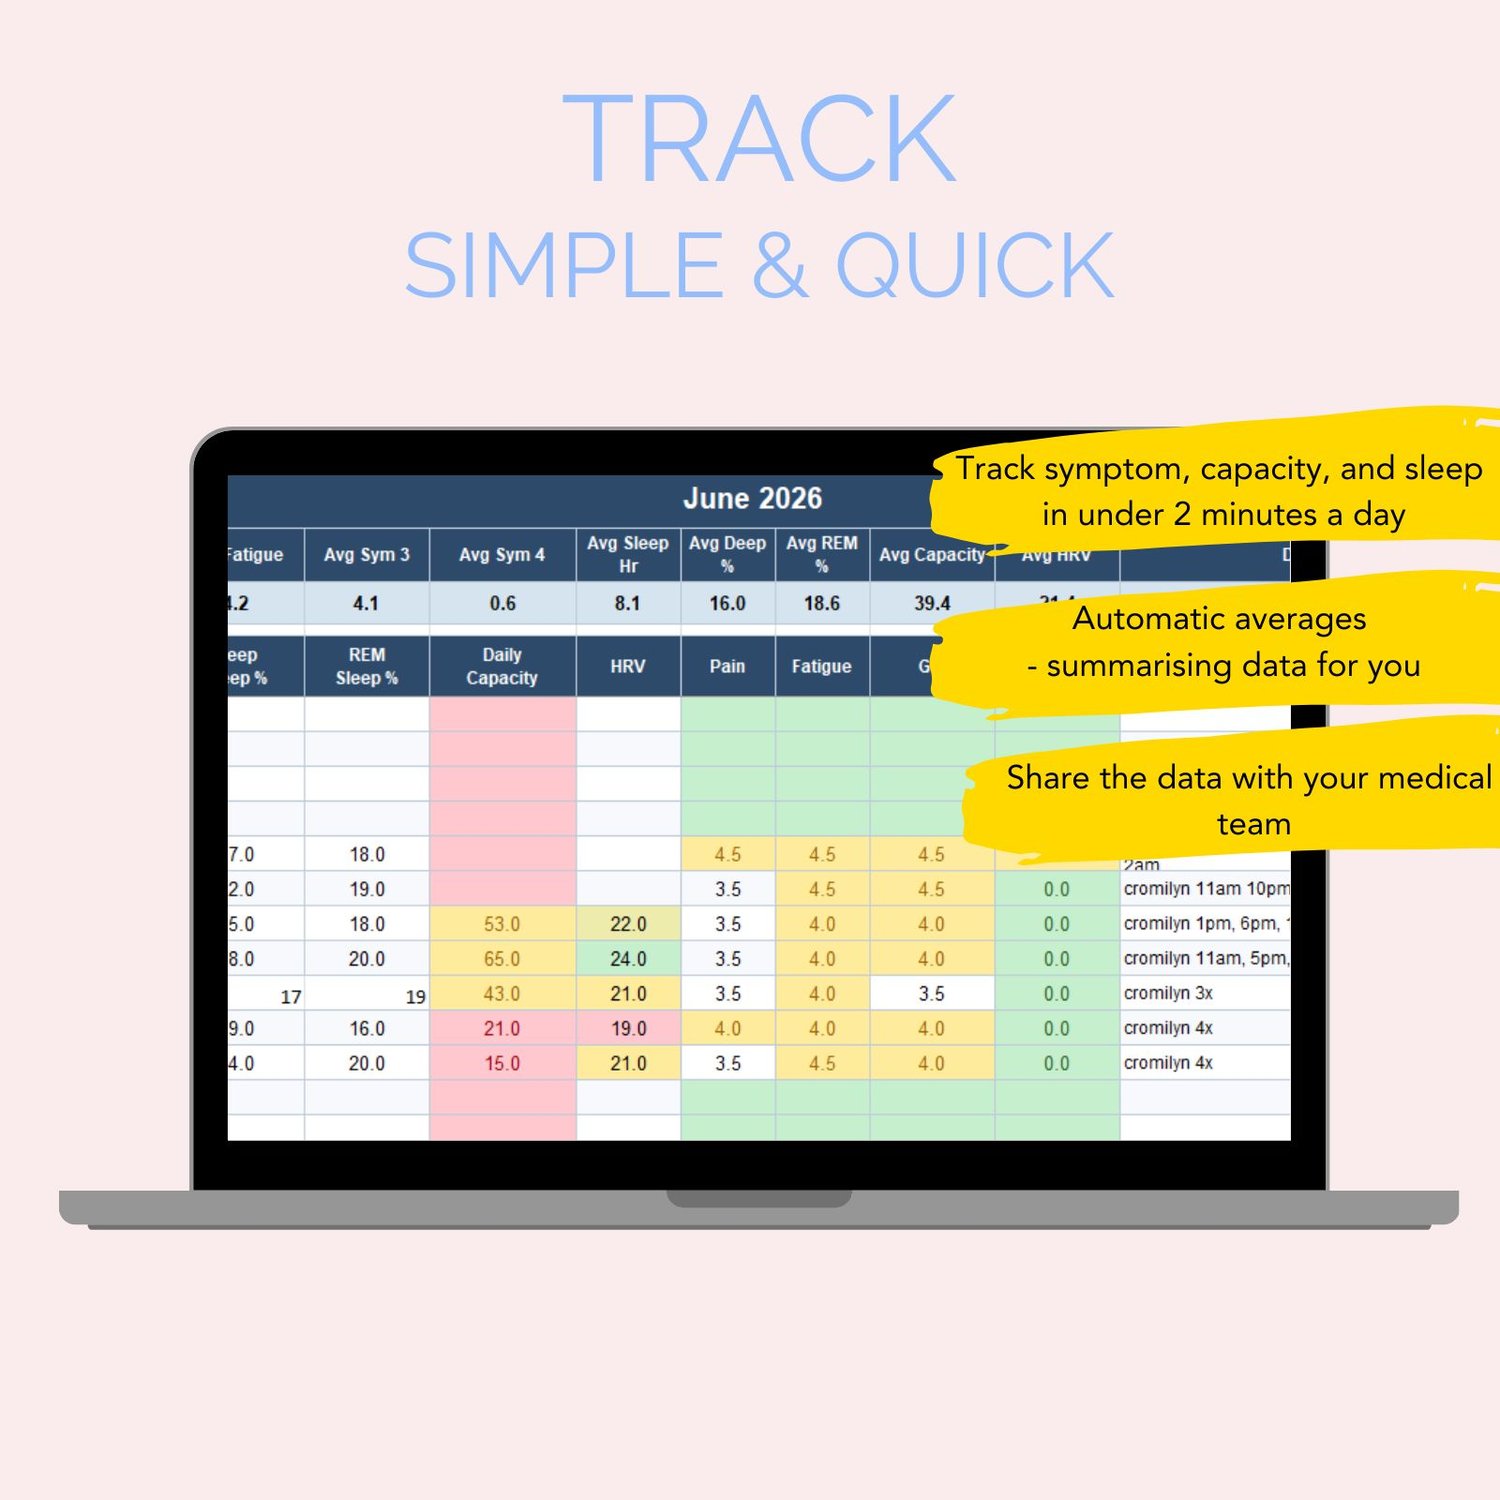
A beautifully designed, easy-to-use Excel spreadsheet that tracks your health data every day — and turns it into patterns you can actually see, understand, and use.
Twelve monthly tabs. One dashboard. Your whole health picture, in one place.
What's inside
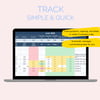
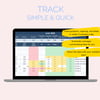
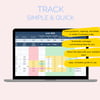
12 Monthly Tracking Tabs
Each month has a row for every day, pre-filled with the date and day of the week. You track:
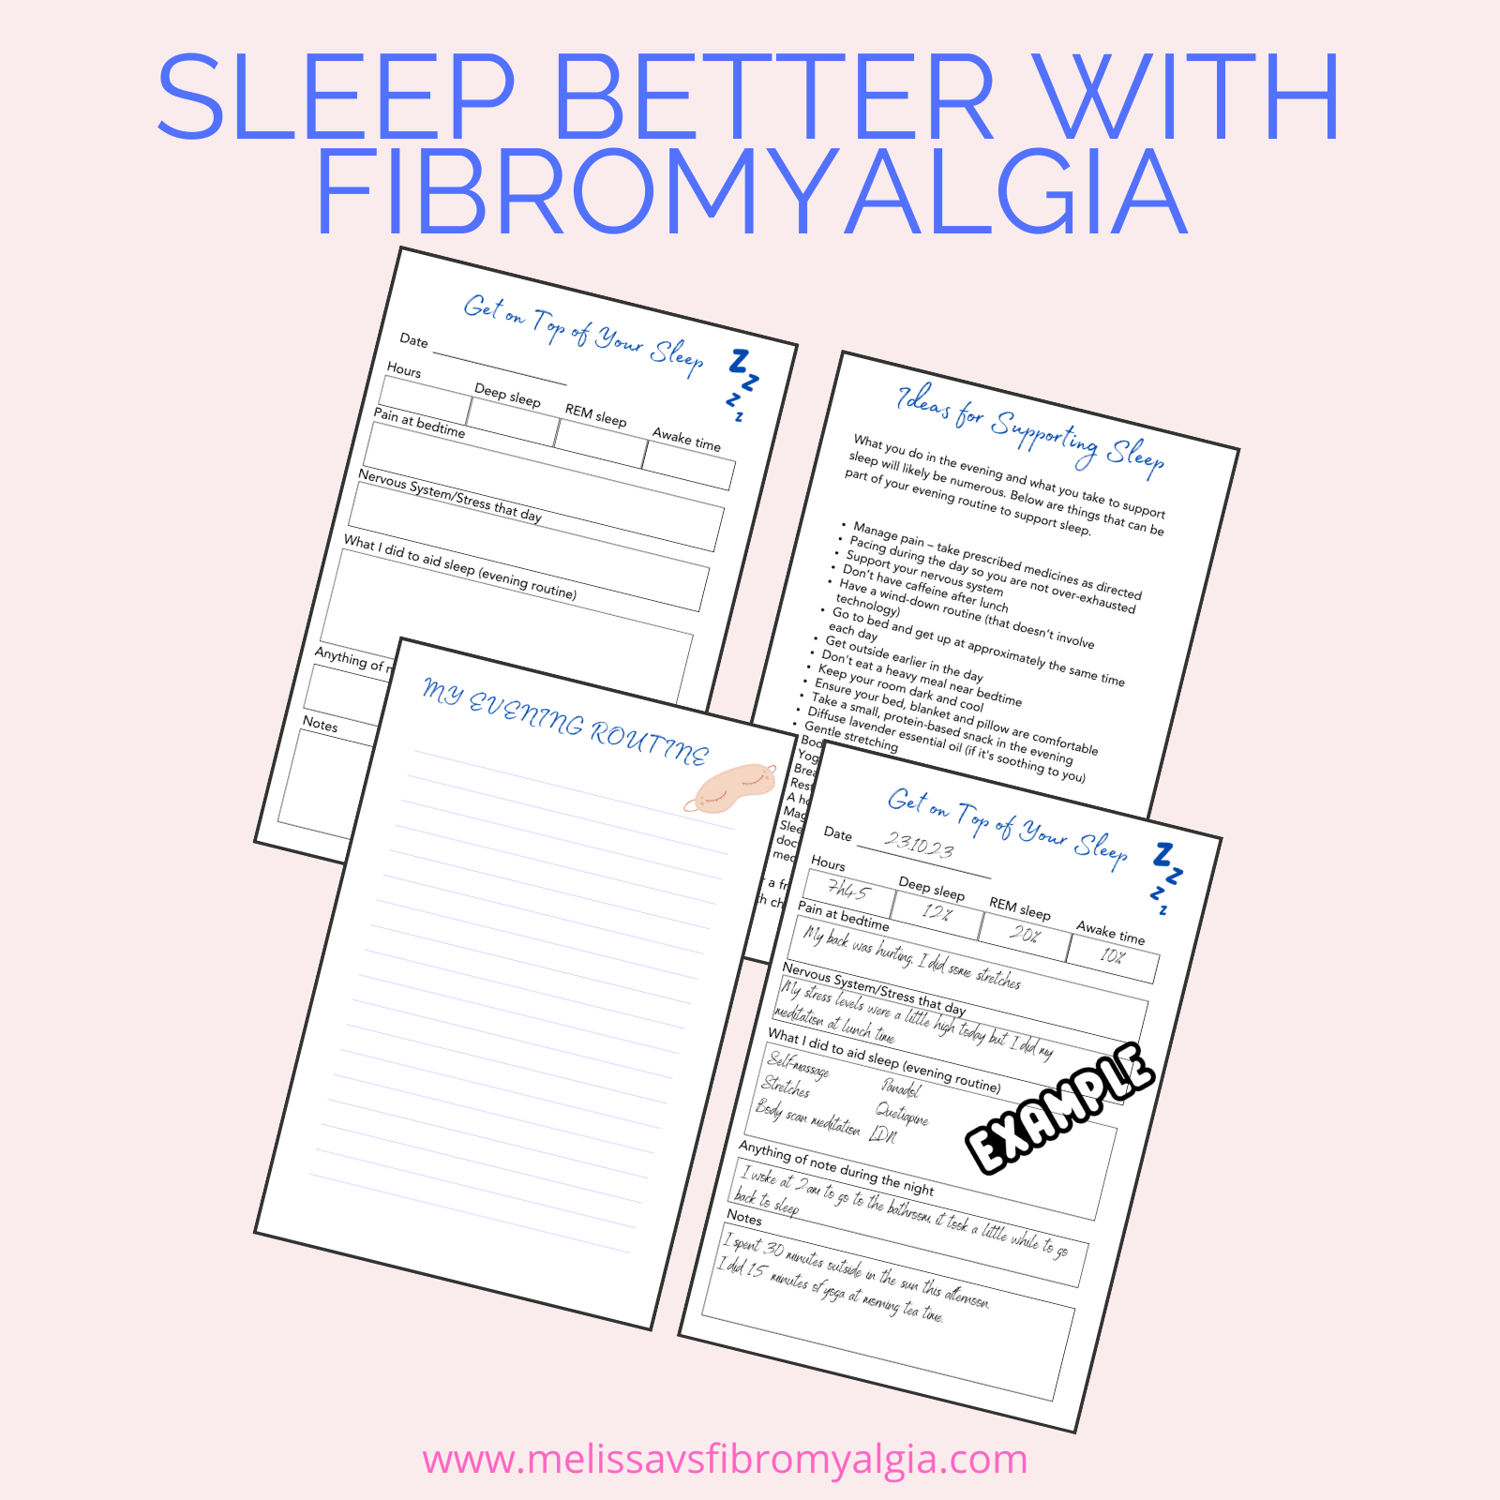
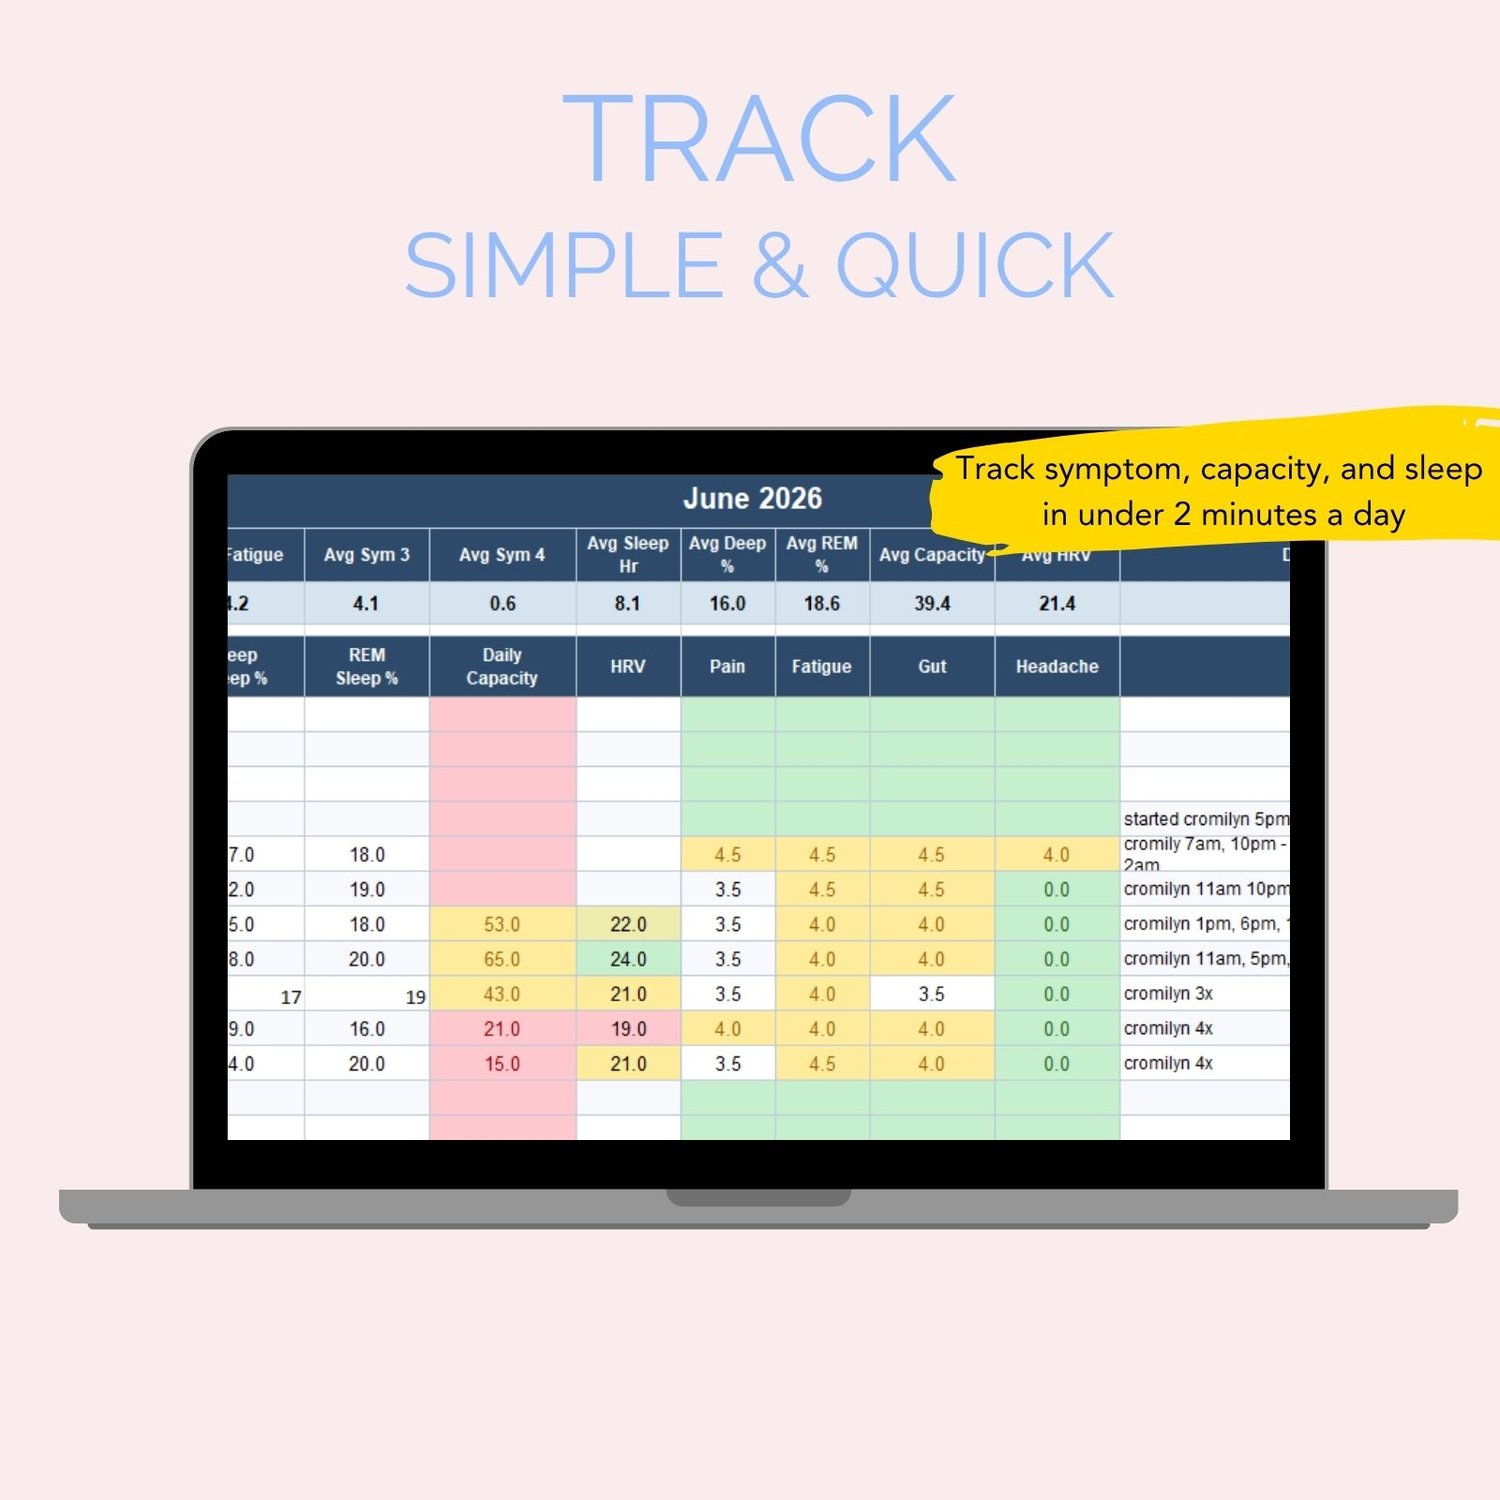
✓ Sleep hours (with colour scale — red for poor, green for good)
✓ Deep sleep and REM percentages (from your wearable or tracker app)
✓ Pain score /10
✓ Fatigue score /10
✓ Two custom symptom columns — you name them (brain fog, nausea, joint pain — whatever matters most to you)
✓ Mood /10
✓ Step count
✓ Meditation and rest minutes
✓ A notes column for anything else
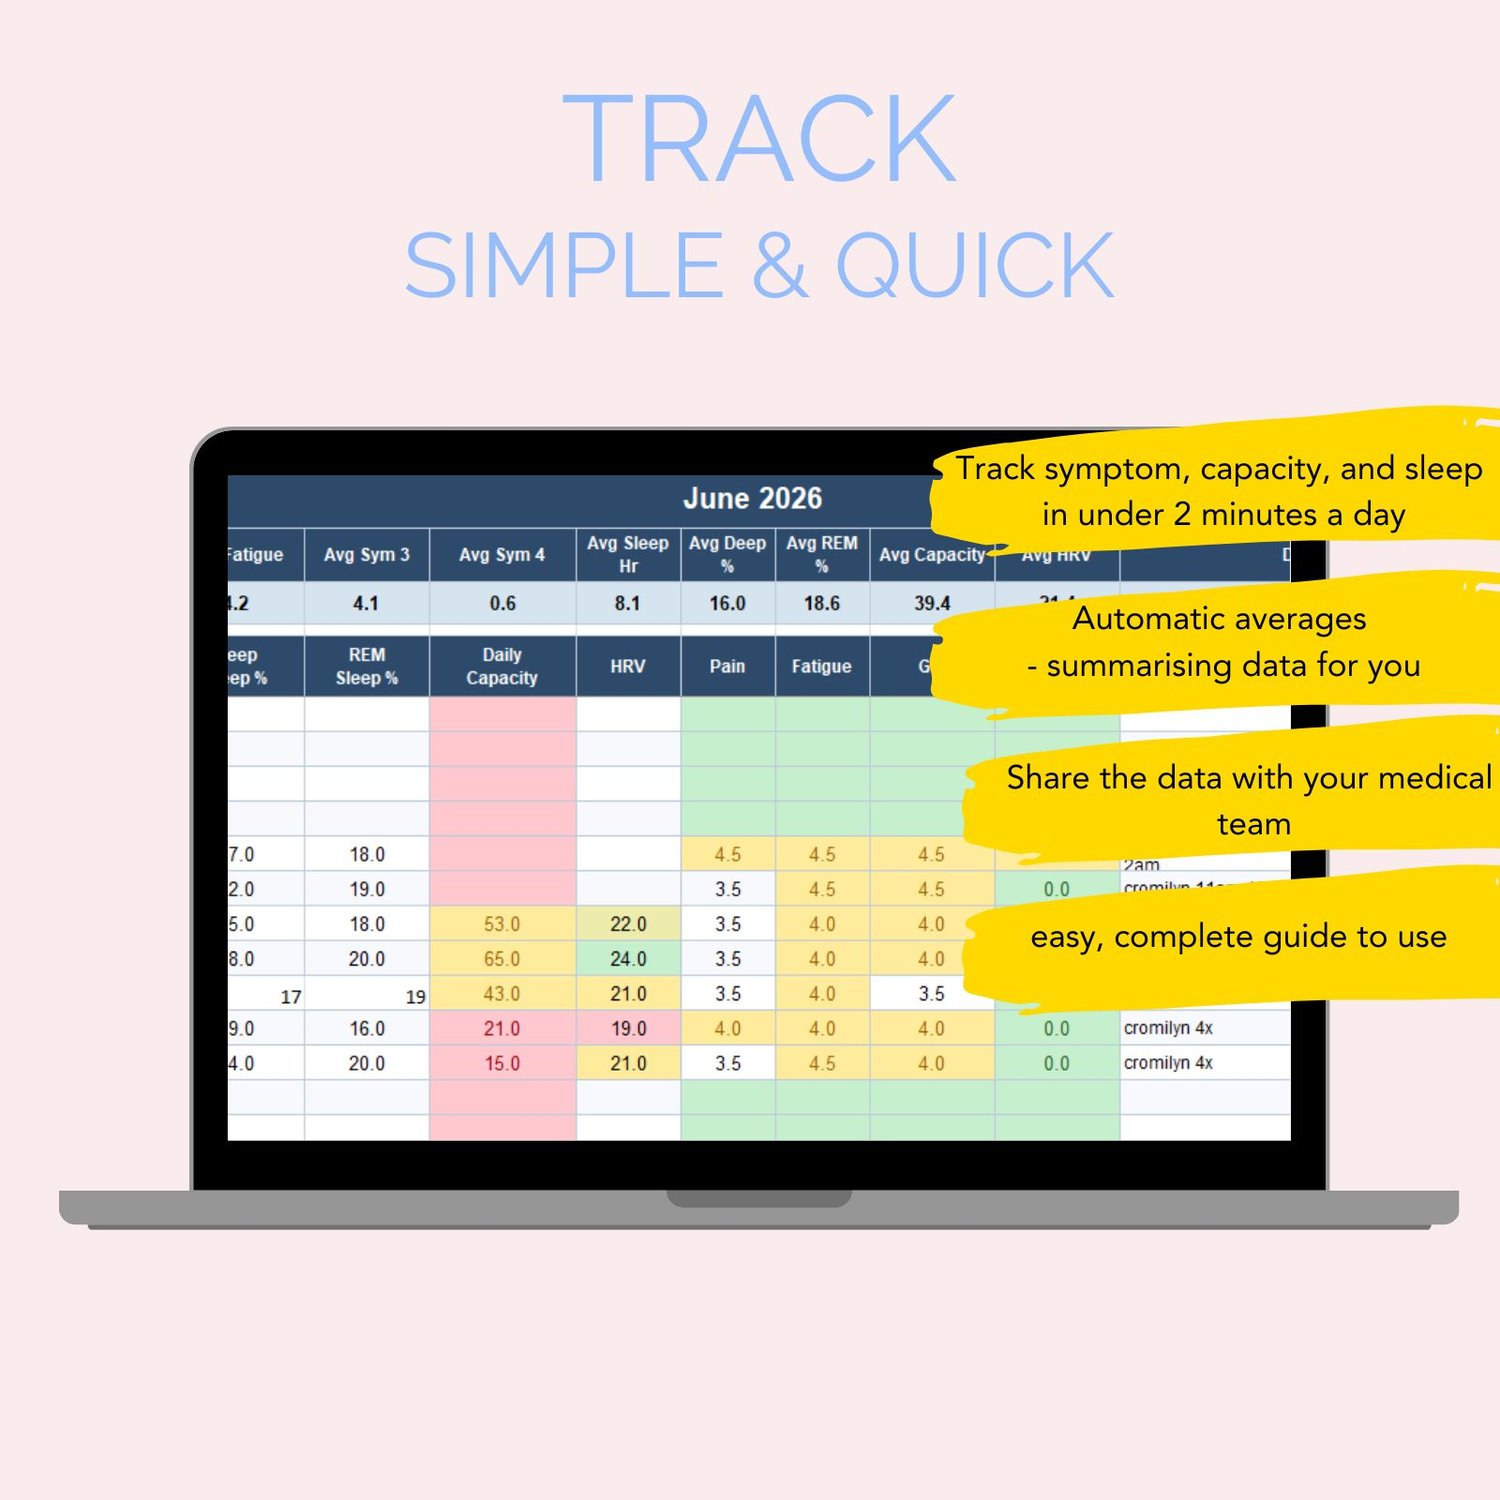
Weekends are colour-coded so they stand out. Symptom scores go automatically green (mild) through amber to red (severe) as you type — no formulas to set up. And a monthly average row at the bottom of each tab is calculated automatically.
Weekly Breakdown
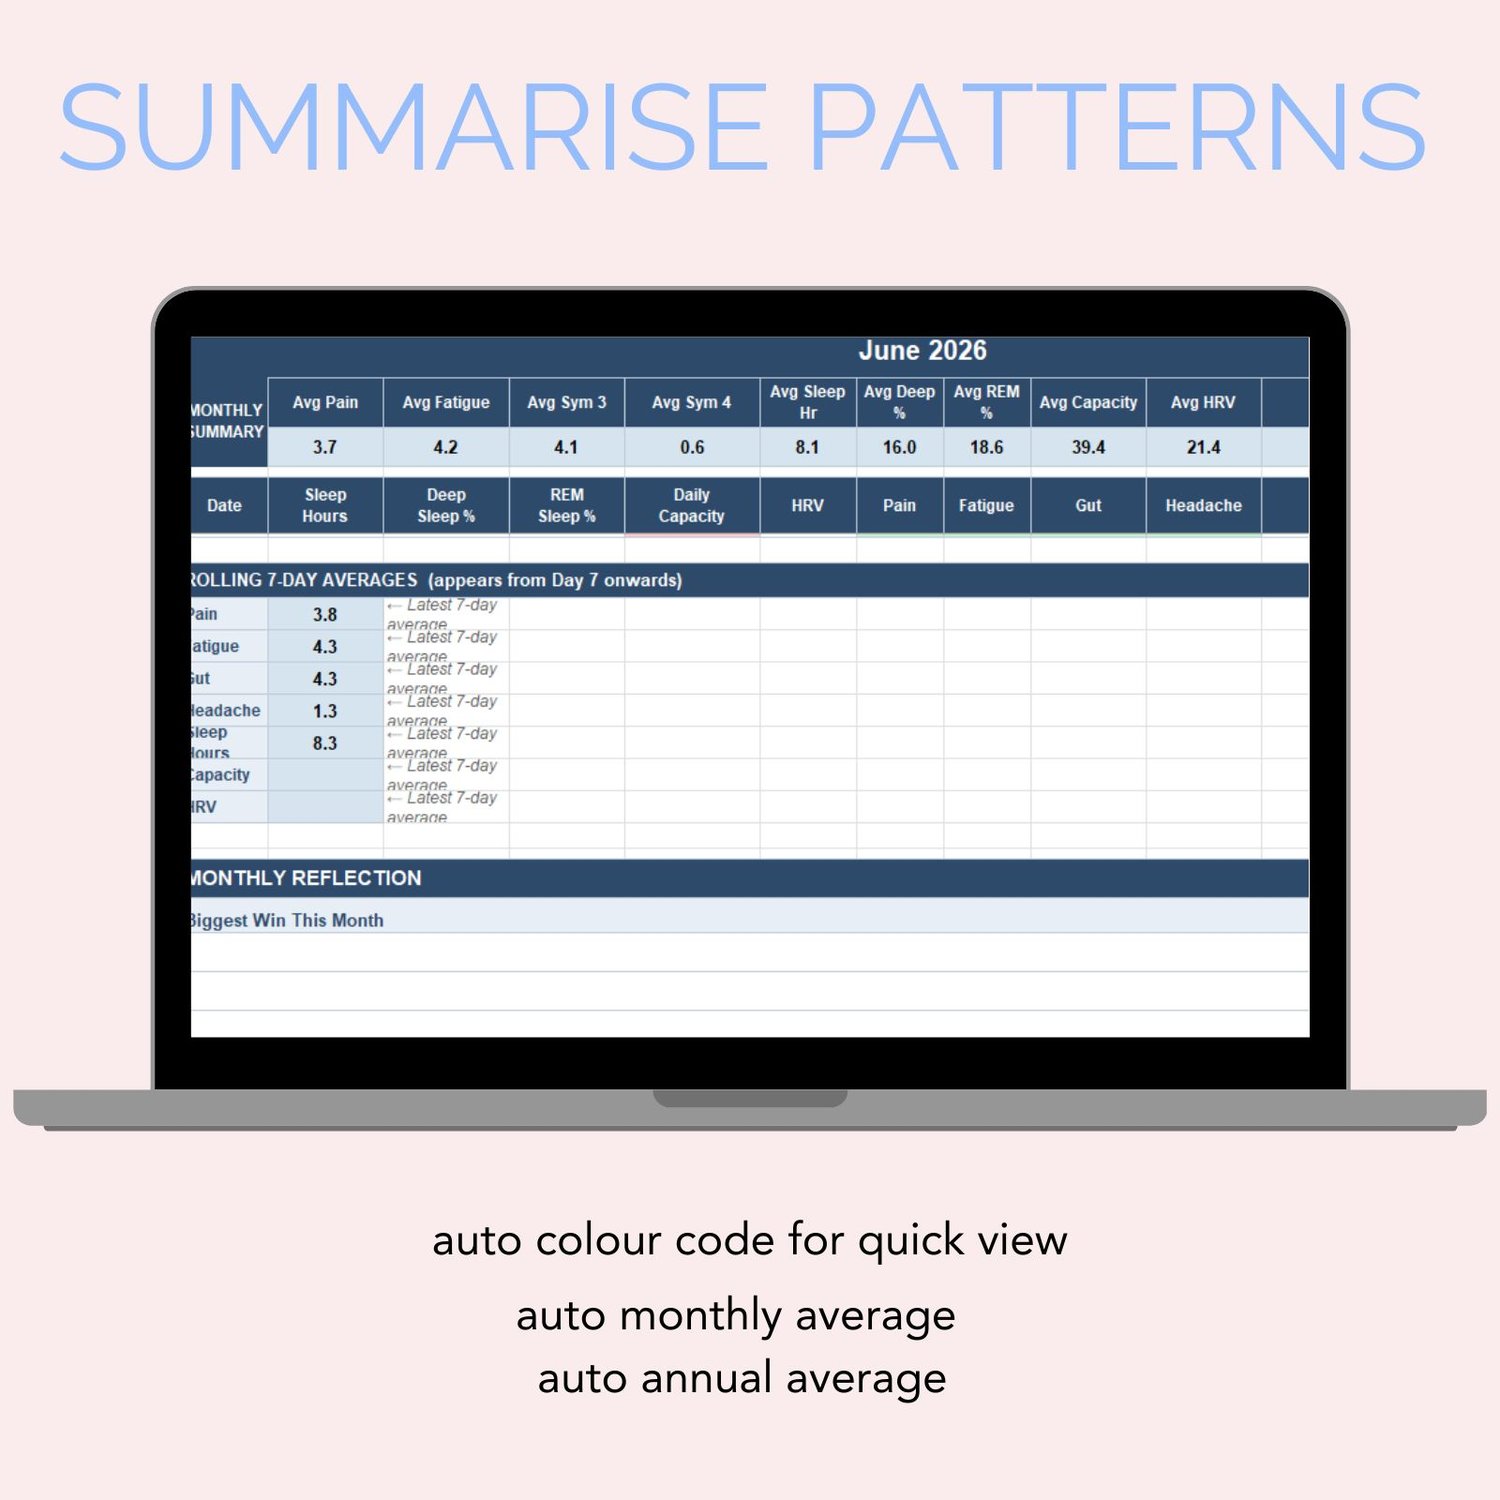
Below each month's data, a weekly-average breakdown shows you patterns within the month—not just across it. Did week three always hit harder? Is your pain consistently lower in the first two weeks? Now you'll know.
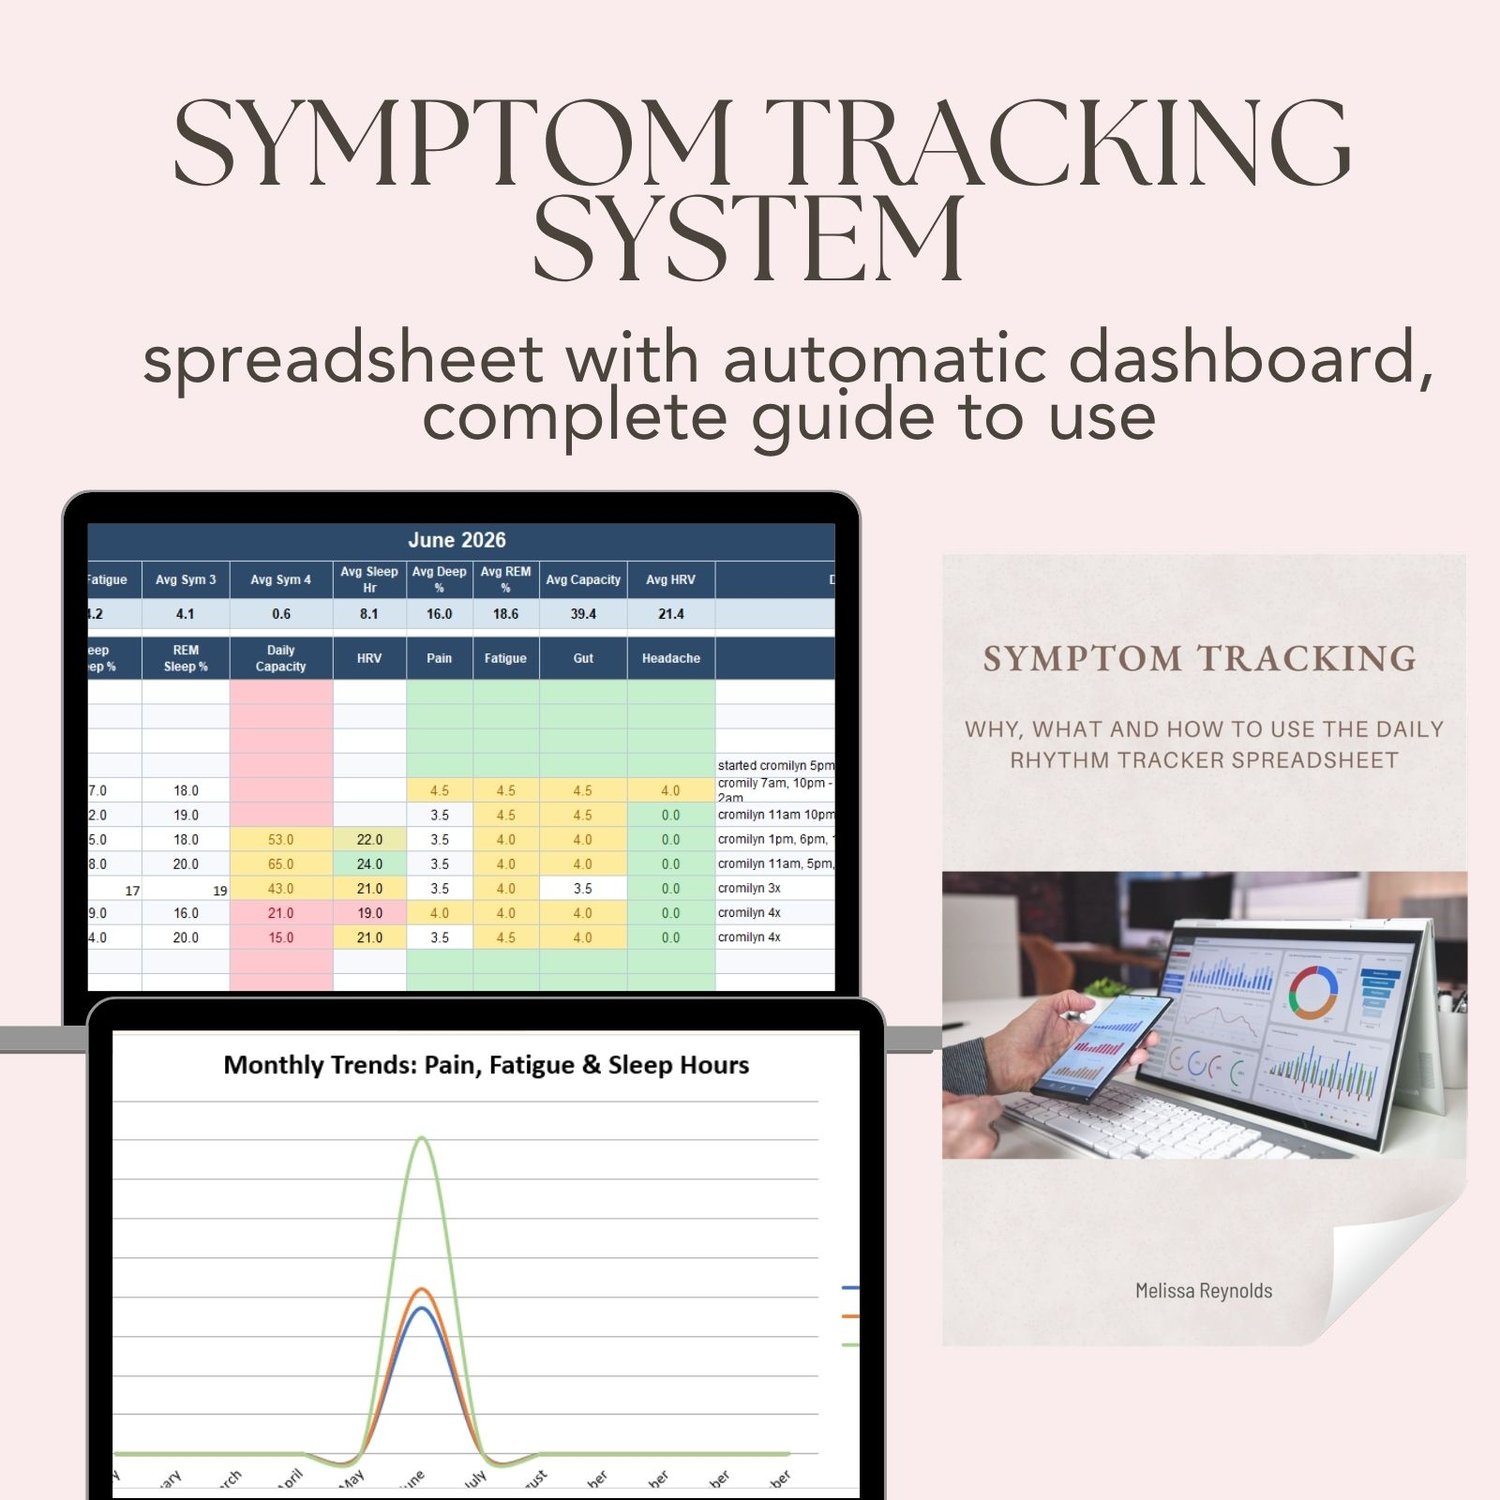
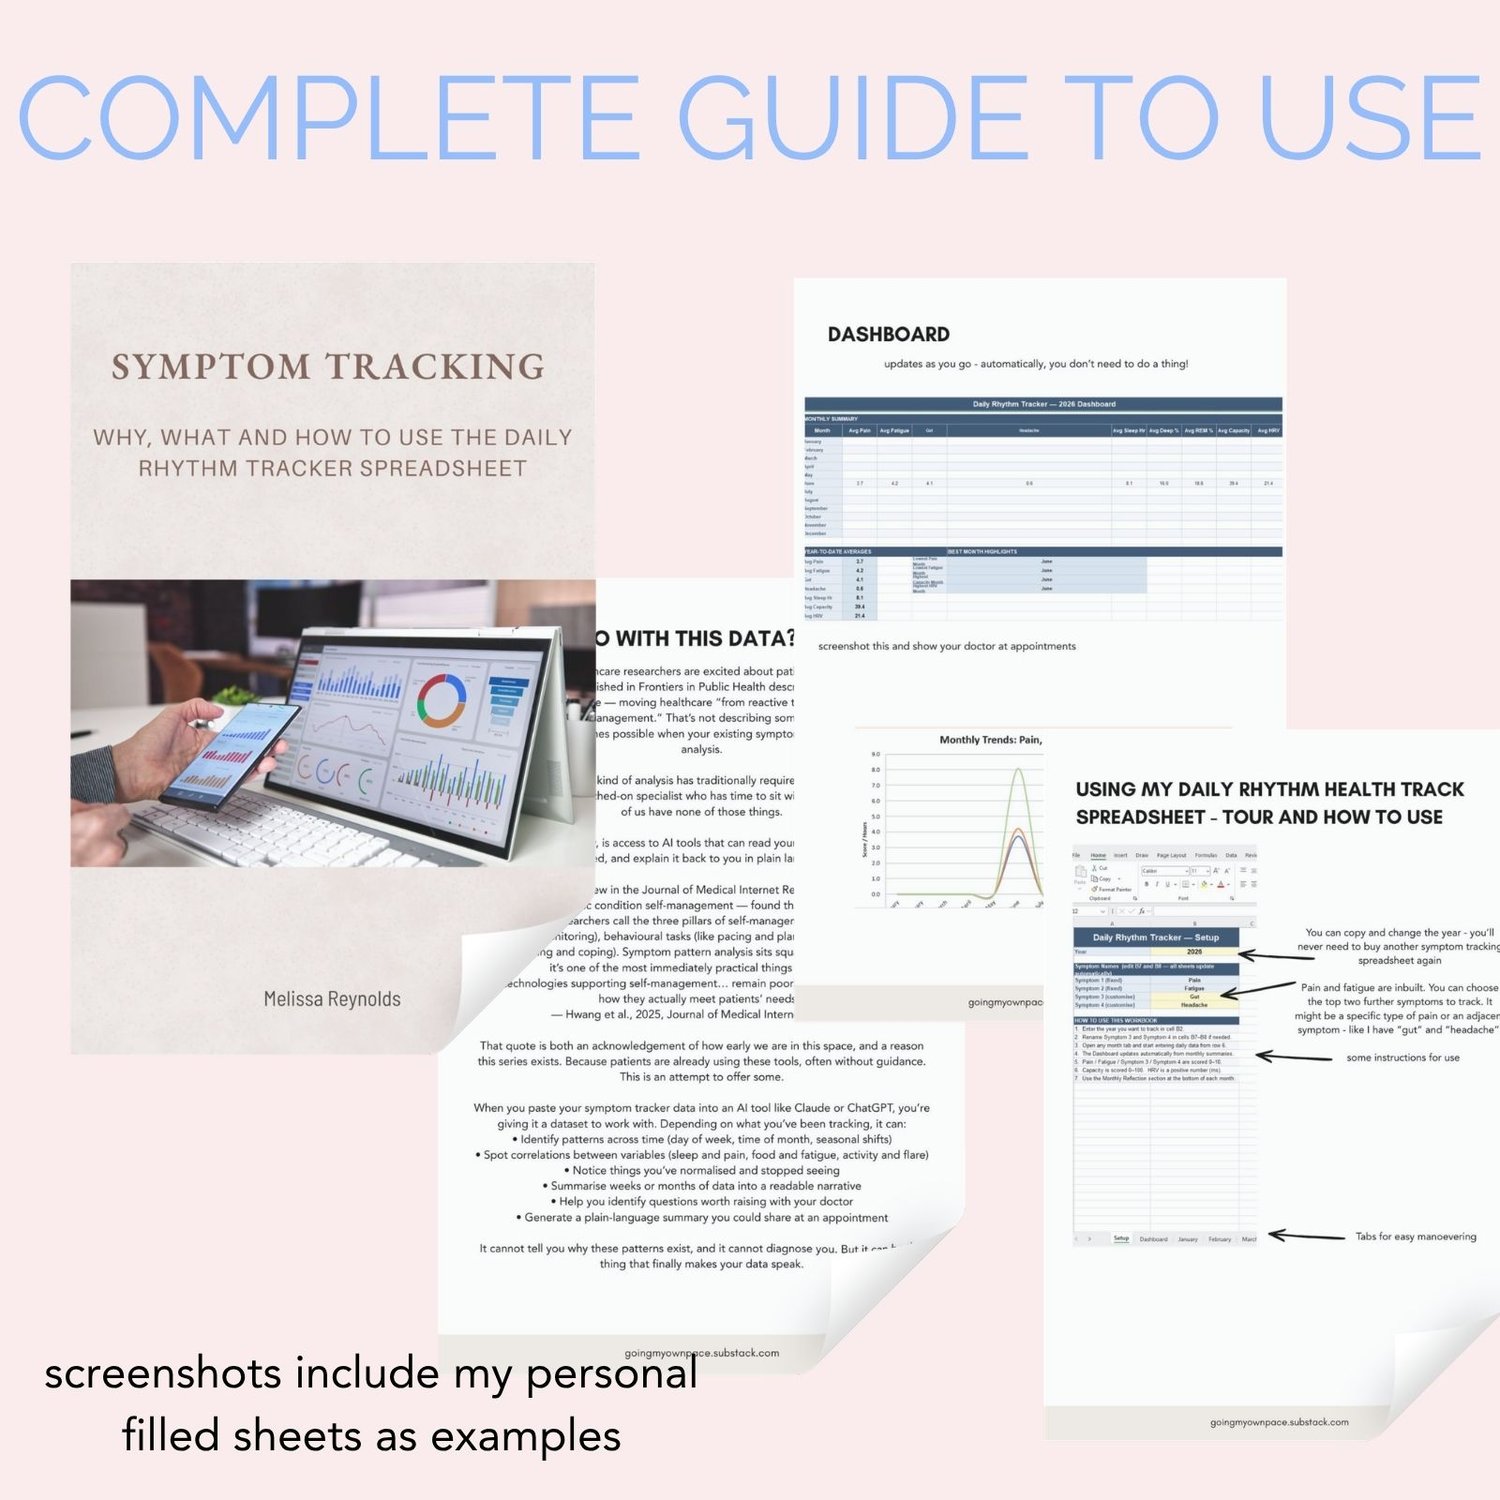
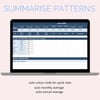
The Pattern Dashboard
One tab that pulls the monthly averages from all twelve months side by side. The whole year, colour-coded, at a glance.
You'll be able to see — visually, instantly — which months were your hardest, which seasons drain you, whether your sleep is improving, and how your symptoms relate to each other over time.
Annual averages are calculated automatically at the bottom.
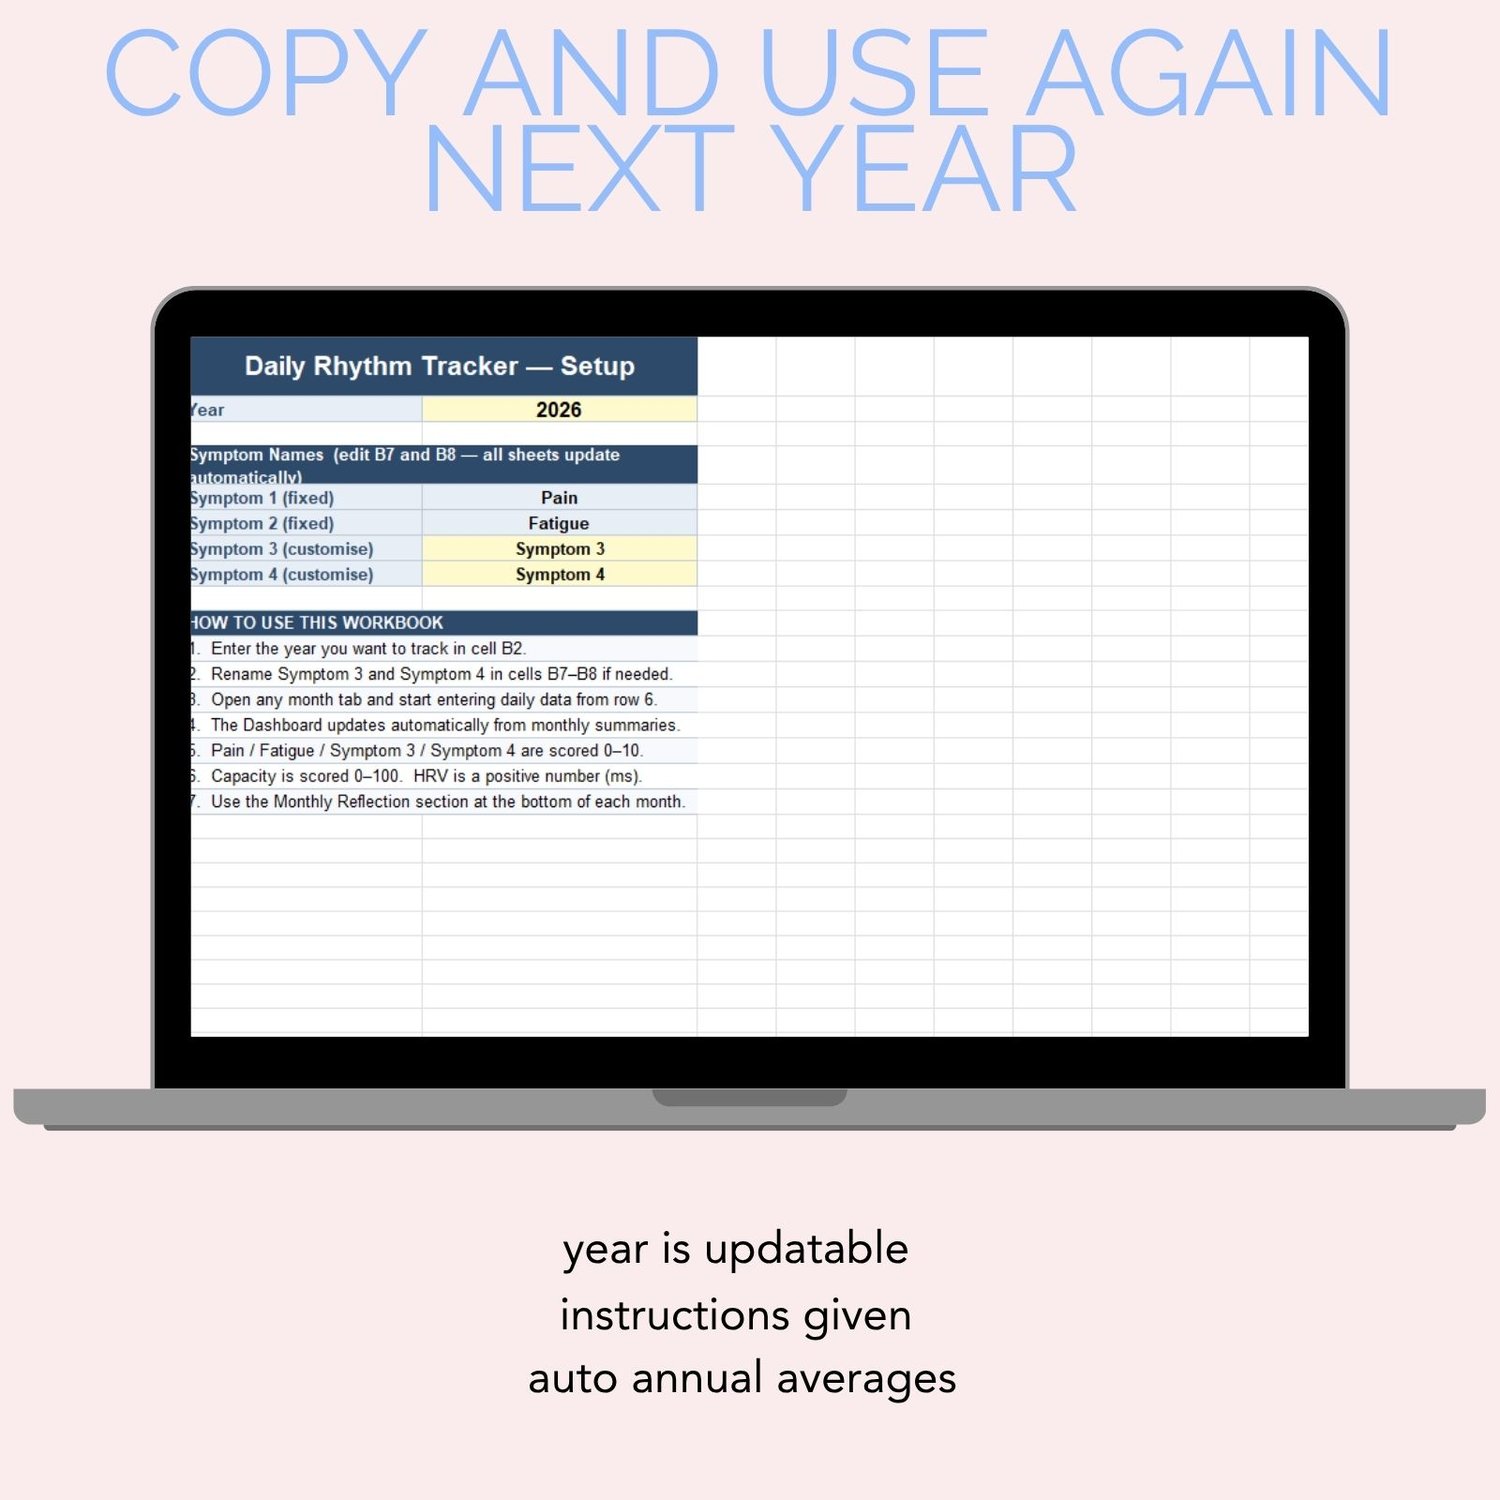
Setup Tab
Enter your name and your symptom names once. They populate across all twelve months and the dashboard automatically. You'll never have to rename a column by hand.
Guide Tab
A warm, plain-language guide written specifically for people managing chronic illness — including a note that you don't have to fill in every single day, and that partial data is still useful data.
This tracker is for you if
✓ You have a chronic illness, pain condition, or fatigue disorder and want to understand your patterns
✓ You're tired of not having answers when your doctor asks how you've been
✓ You've tried generic health apps that weren't built for the reality of chronic illness
✓ You want to see whether your sleep, pain, and energy are connected — and when
✓ You're learning to pace and need honest data about your activity and rest
✓ You want to feel more informed, more prepared, and more in control of your own health story
Works with your tools
The sleep and activity data fields work with any wearable or health tracker — Garmin, Fitbit, Apple Watch, Oura Ring, Samsung Health, Whoop, or even just your phone's step counter. If your device shows it, you can track it here.
The file opens in Microsoft Excel and Google Sheets. All formatting and colour scales are fully compatible with both.
What you receive
✓ One .xlsx file and one PDF Guide to Symptom Tracking — instant digital downloads
✓ Compatible with Microsoft Excel (Windows and Mac) and Google Sheets
✓ 12 monthly tabs pre-set for 2026 — easy to update for any year
✓ Full setup instructions inside the file
✓ Lifetime access — download and use forever (simply make a copy for each year)
Questions
Do I need to know how to use Excel?
No. The spreadsheet is fully set up — you just open it, fill in your details on the Setup tab, and start typing your daily numbers. No formulas, no settings, no technical knowledge needed.
Does it work on Google Sheets?
Yes. Upload the file to Google Drive and open it in Google Sheets. The colour coding and formulas are fully compatible.
Can I customise the symptoms it tracks?
Yes — that's one of the most important features. There are two symptom columns you name yourself on the Setup tab. They update automatically across every month tab and the dashboard. You track what matters to you, not a generic list.
What if I miss days?
That's okay. The averages are calculated to skip empty cells, so partial months still give you useful data. The guide tab includes a gentle note on this — this tool is here to support you, not add pressure.
Is this a physical product?
No. This is a digital download — you'll receive an .xlsx file immediately after purchase. If you're looking for a printed version, take a look at the rest of the shop.
Can I share it with a friend?
The file is licensed for personal use for one person. If a friend would like a copy, please direct them to purchase their own — it helps keep this kind of resource sustainable.
This tool is available for $9.99, so it's accessible to everyone.
You already know more about your body than most doctors ever will.
This tracker helps you prove it.