

Hotel Pickup Forecasting Model: 90-night hotel occupancy forecast with booking curves and backtest
Full description
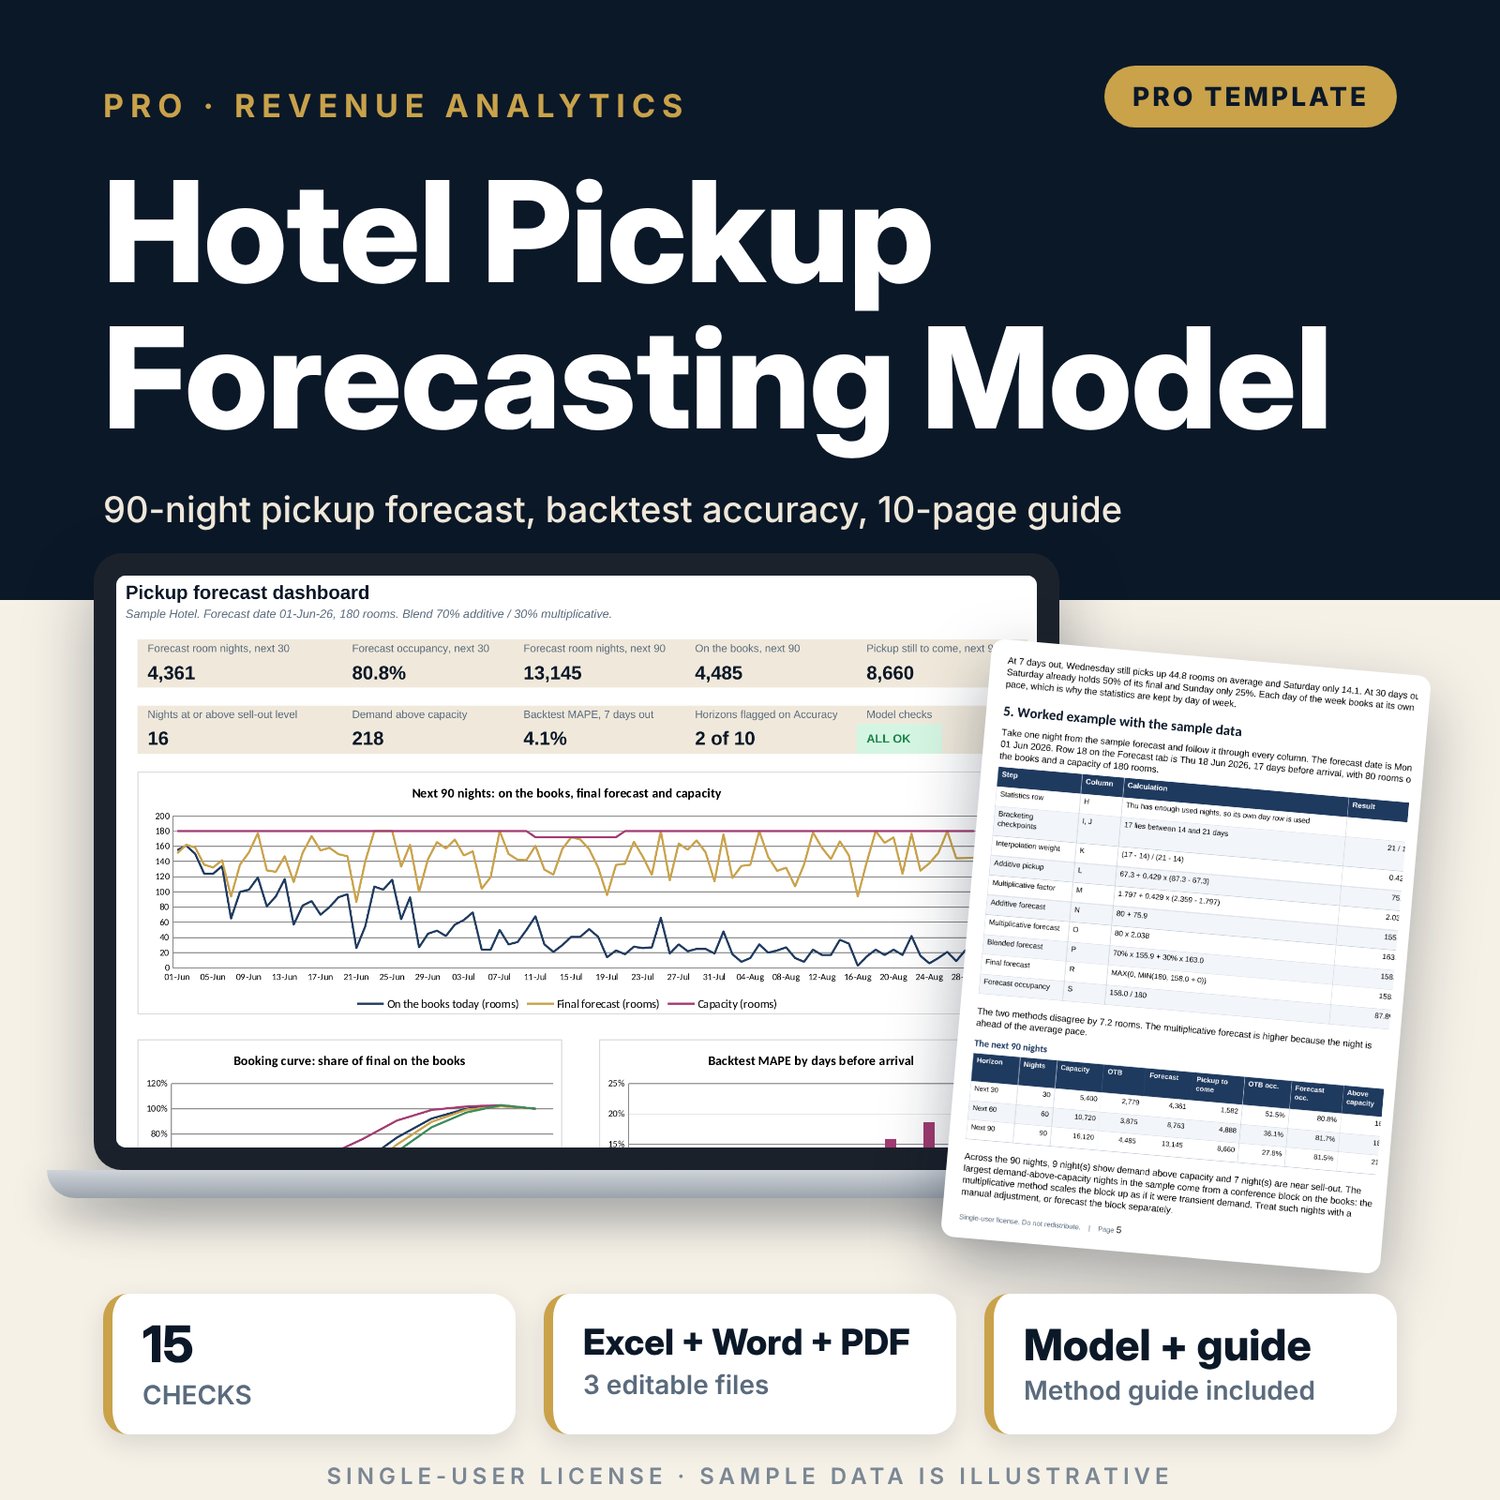
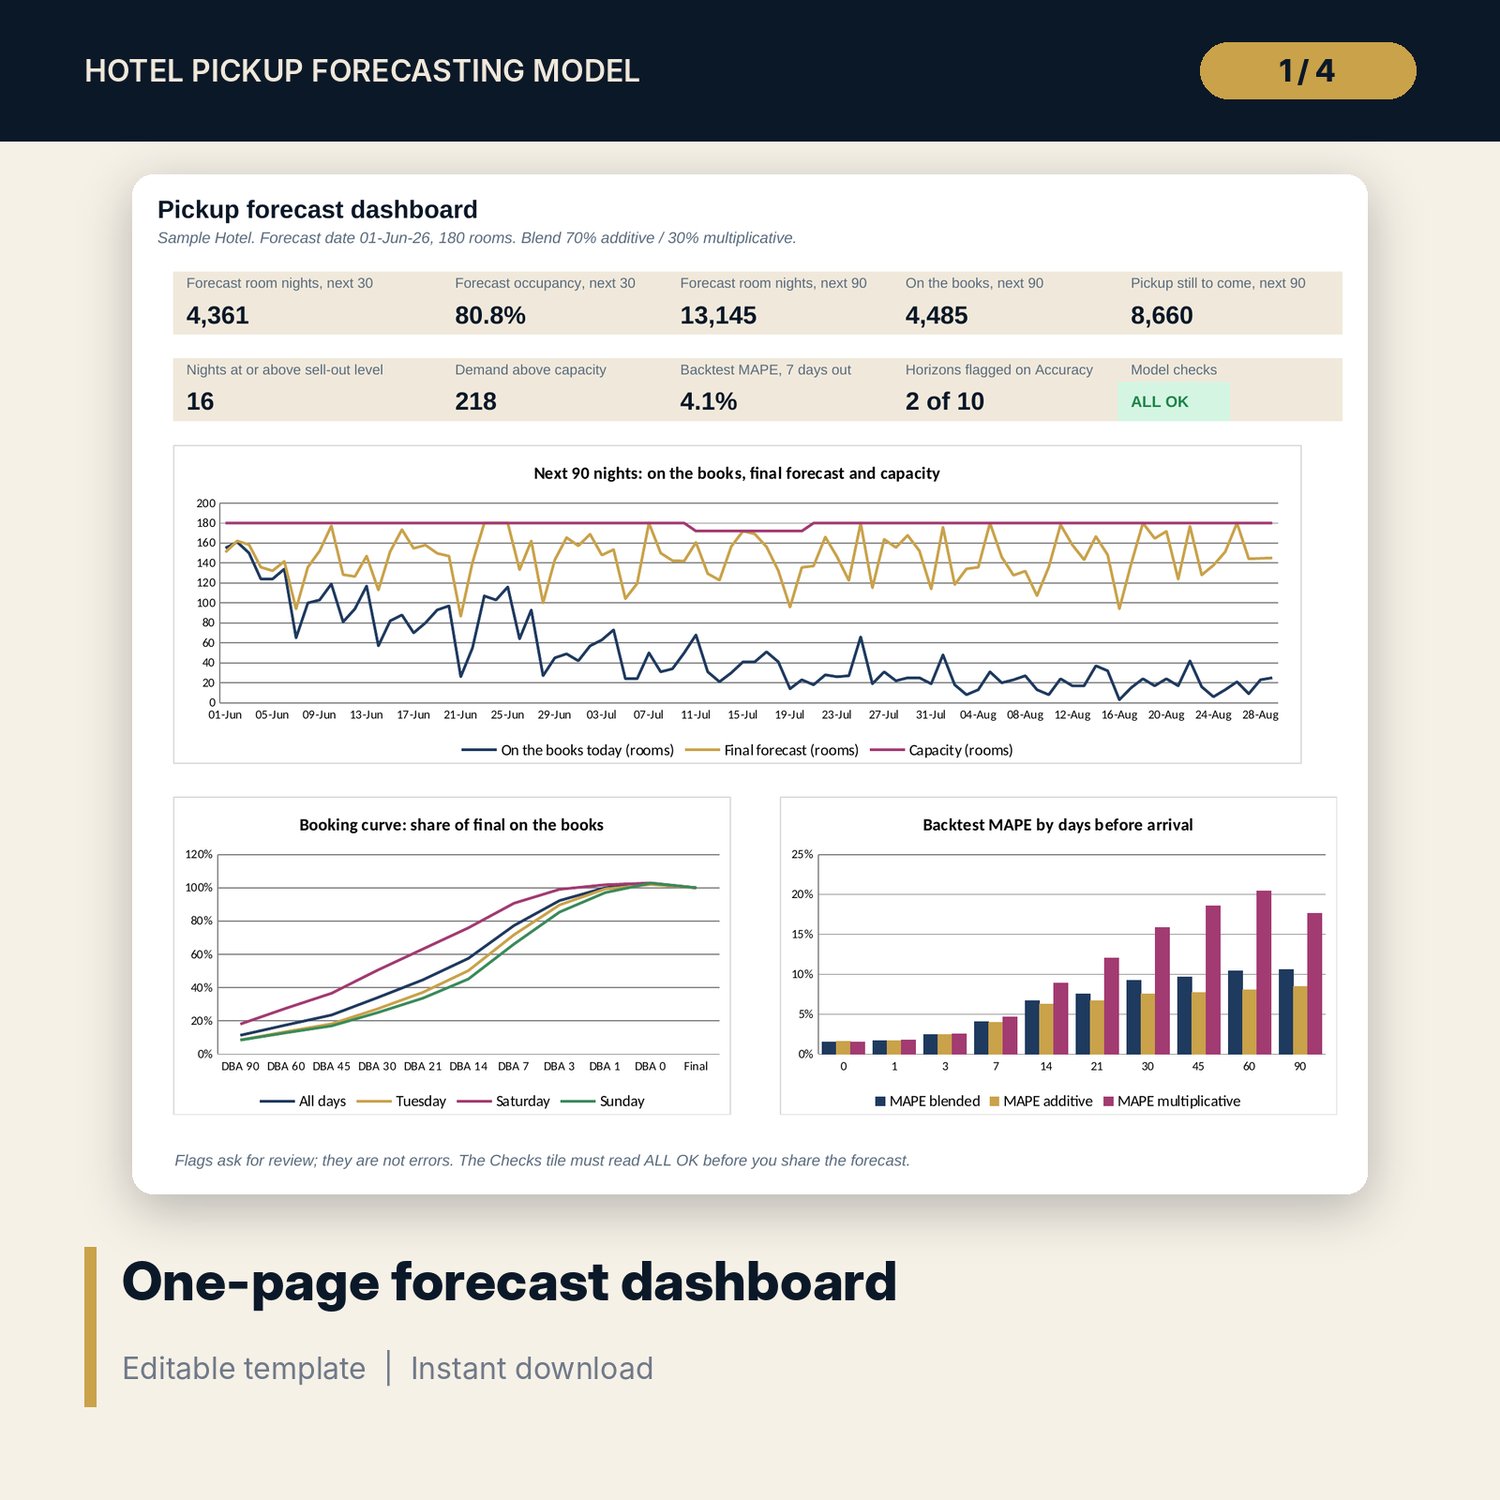
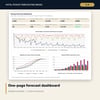
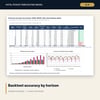
For revenue managers, general managers and front office managers who need a daily forecast of final rooms sold for the next 90 nights. You paste a year of booking snapshots: rooms on the books at 90, 60, 45, 30, 21, 14, 7, 3, 1 and 0 days before arrival plus the final for each stay night. The workbook flags missing values, typing errors and outliers, averages pickup by day of week and checkpoint, and turns today's on-the-books into an additive forecast, a multiplicative forecast and a blend with weights you set, interpolating between checkpoints and capping at capacity less rooms out of order. A backtest holds out the latest weeks, rebuilds the statistics from the older weeks only and reports MAD, MAPE, bias and tracking signal by horizon and method, so you set the blend from evidence. A weekly outlook, two what-if grids and a one-page dashboard support the revenue meeting.
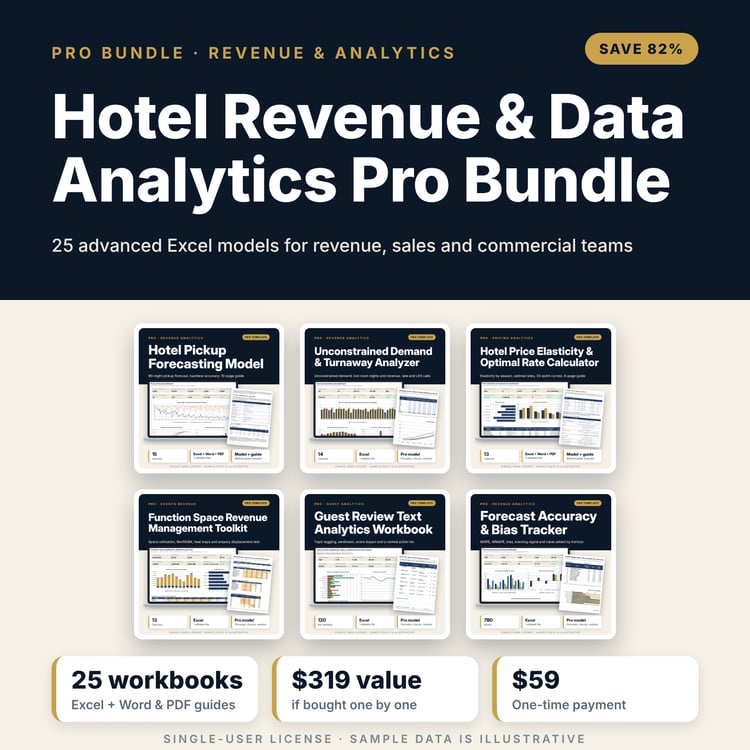
Save with a bundle: this workbook is also in the Hotel Revenue & Data Analytics Pro Bundle, 25 workbooks for $59 instead of $319. All 100 Pro workbooks are in the Pro Library for $119, and all 241 templates and workbooks are in the Ultimate Hospitality Library for $149.
What is inside
- Hotel_Pickup_Forecasting_Model.xlsx: 11 tabs, 14,335 formulas, 6 native charts, 9 drop-down and input rules
- History: 364 sample stay nights (52 weeks) x 10 checkpoints plus final, with data flags and room for 56 weeks
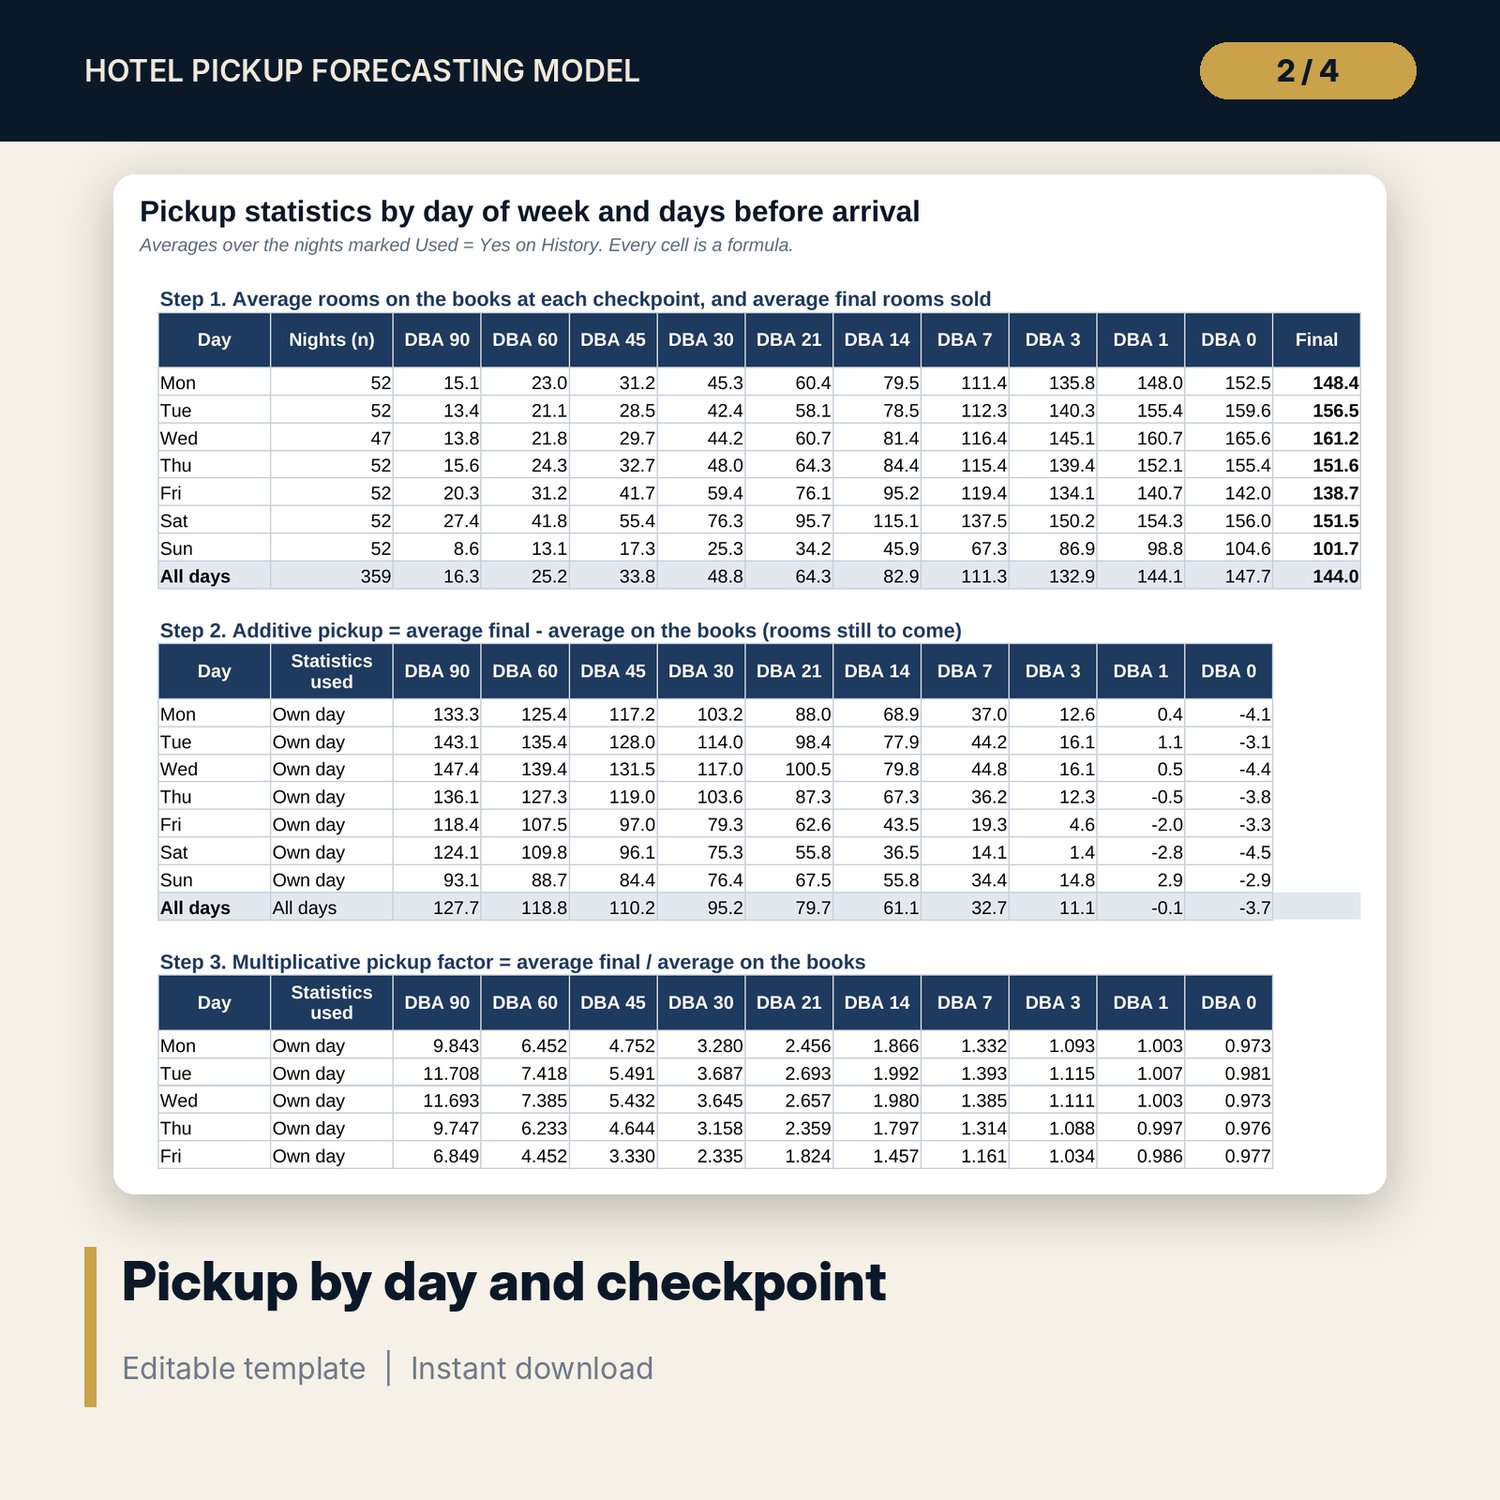
- Pickup_Stats: average on the books, additive pickup, multiplicative factor and booking curve for 7 days x 10 checkpoints, plus the same statistics on the training weeks
- Forecast: 90 nights with interpolation, both methods, blend, capacity cap, manual adjustment and flags
- Outlook: 13-week view, 30/60/90-night summary and two 5 x 5 what-if grids (blend weight x pickup pace)
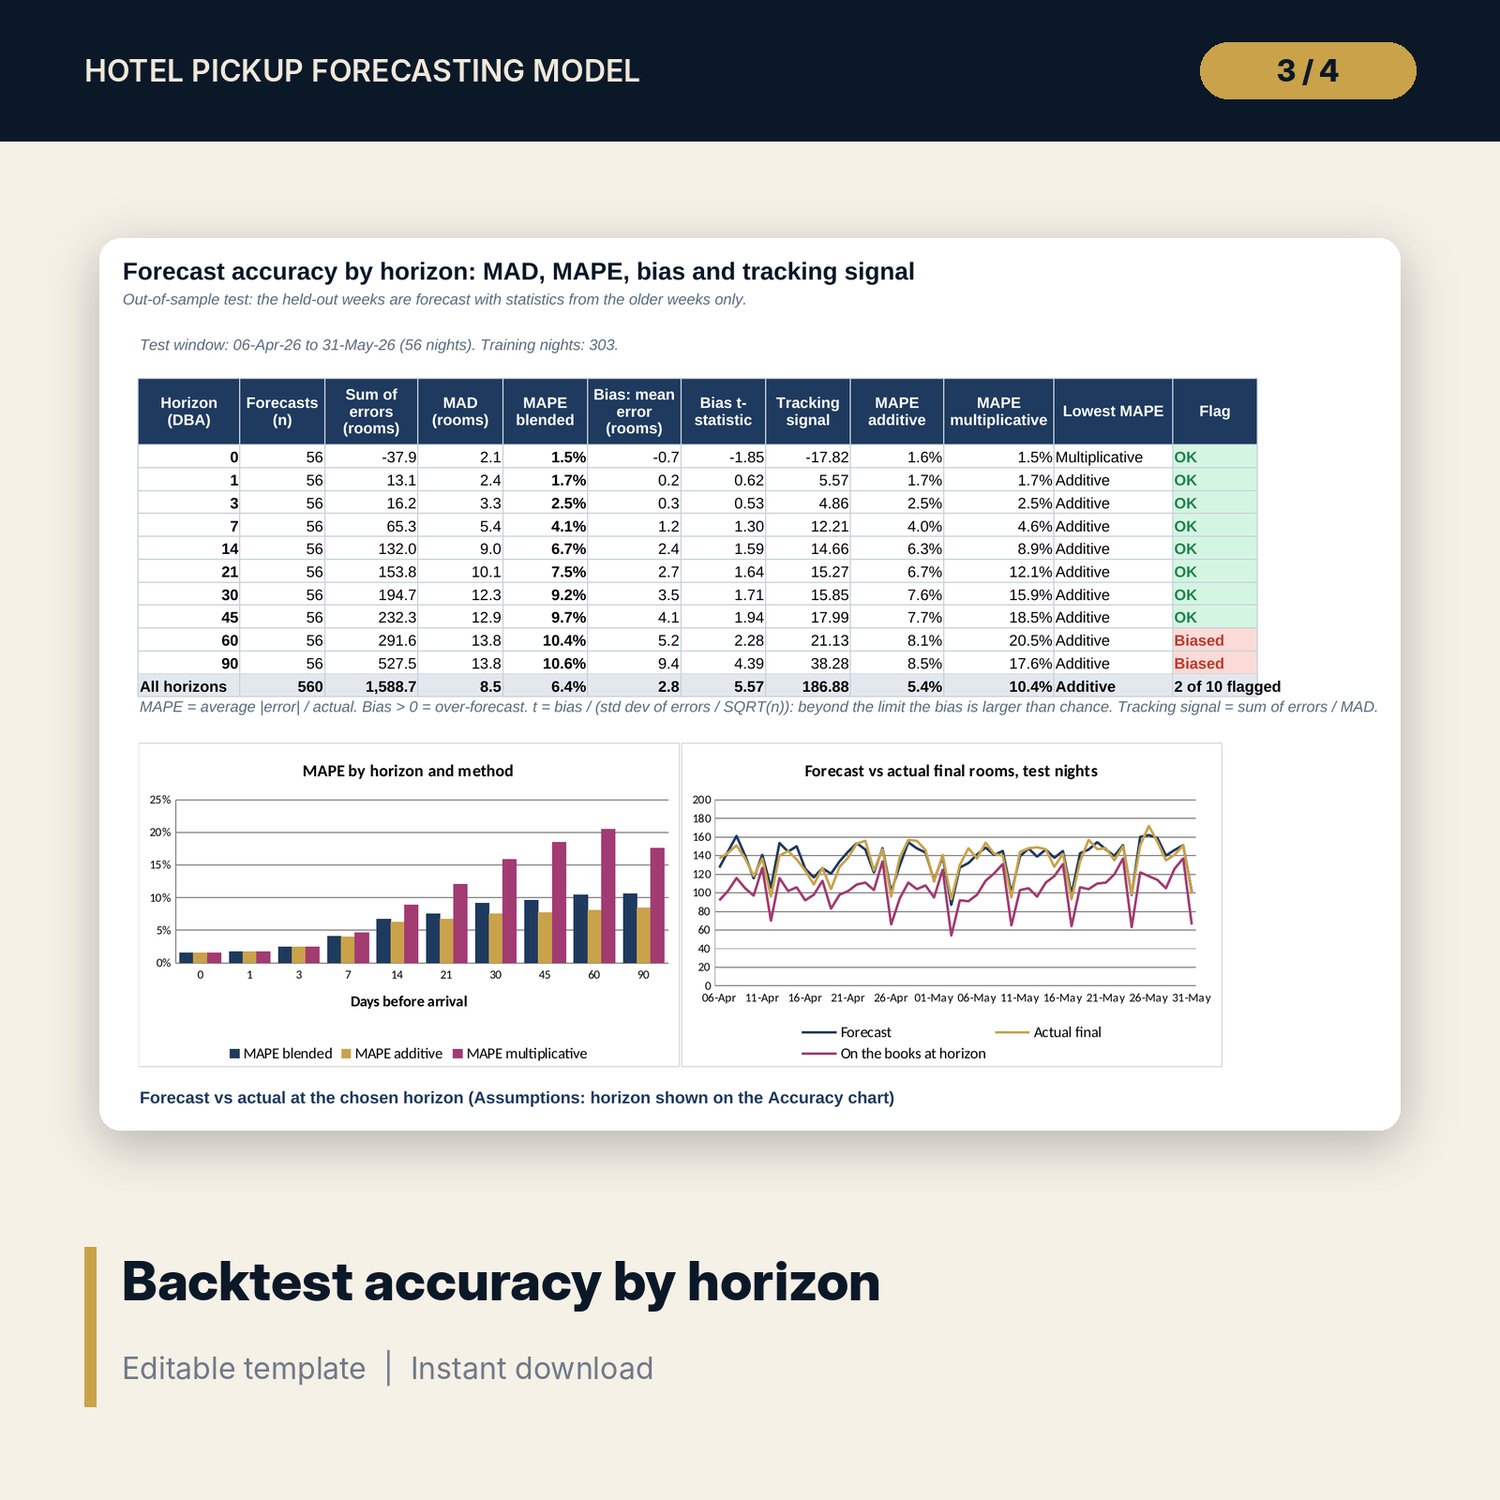
- Backtest and Accuracy: 560 out-of-sample forecast cases; MAD, MAPE, bias and tracking signal for 10 horizons; forecast vs actual chart
- Dashboard (one printed page), 15 integrity checks and a Method tab with 19 documented calculations
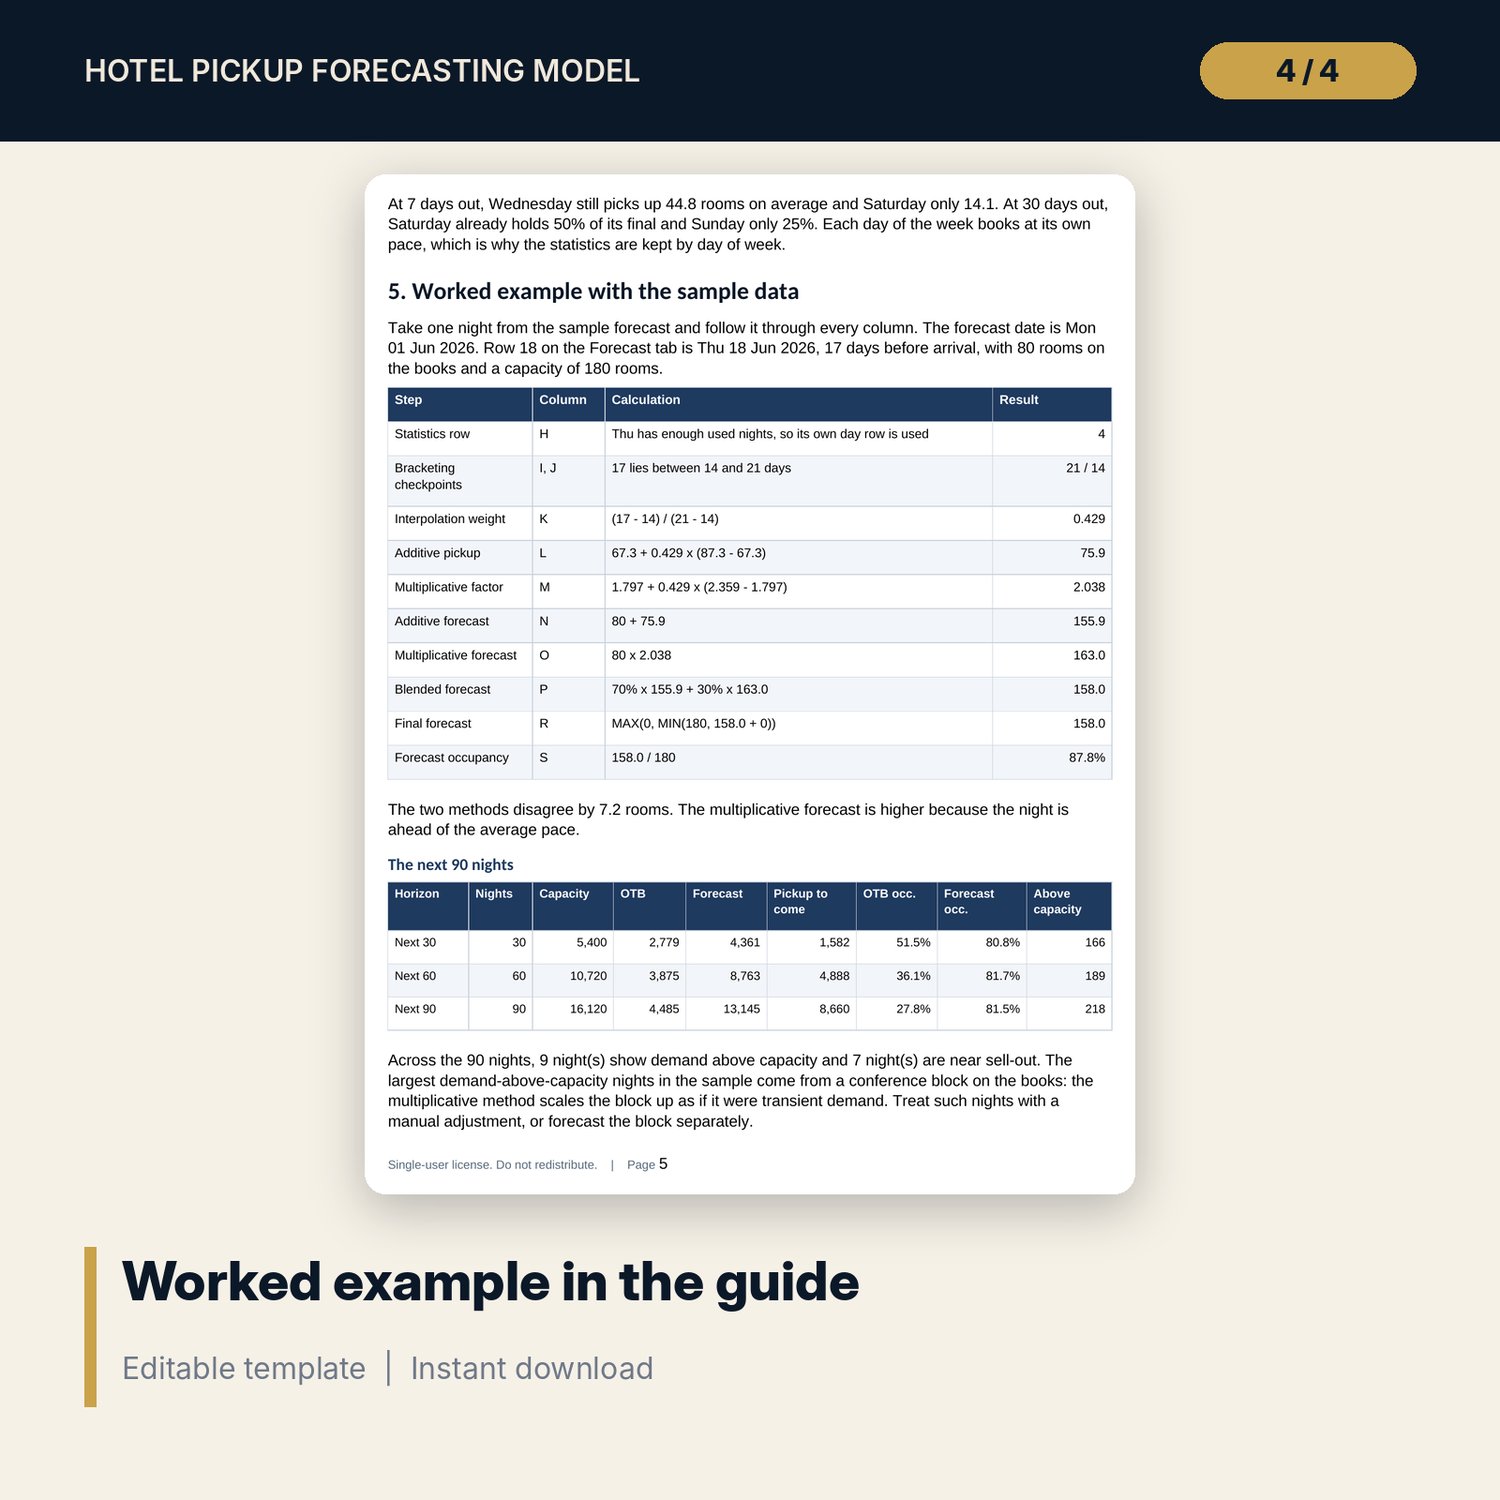
- Hotel_Pickup_Forecasting_Guide.docx and Hotel_Pickup_Forecasting_Guide.pdf: 10-page guide with data cleaning rules, the method in equations, a worked example on the sample results, accuracy reading, actions, mistakes, a routine checklist and a glossary
- README.txt and LICENSE-and-Terms.txt
How it works
- Enter rooms, the forecast date, the lookback and the backtest window on Assumptions.
- Paste one row per stay night on History: rooms on the books at each checkpoint and the final. Clear the flags.
- Paste today's on-the-books for the next 90 nights on Forecast, with rooms out of order and known adjustments.
- Read Accuracy and set the additive and multiplicative weights toward the method with the lower error.
- Use Outlook and the Dashboard in the revenue meeting. Confirm the Checks tab shows ALL OK.
Details
- Formats: XLSX workbook, DOCX guide, PDF guide
- Language: English
- Software: Excel 2016 or later, or LibreOffice Calc 7 or later
- No macros, no data tables, no array formulas, no external links
- Delivery: instant download
Good to know
- Sample data is illustrative. Replace it with your own booking history.
- The forecast is a planning aid, not financial advice. Verify local requirements before you change rates or overbooking levels.
- Pickup assumes the future books like the past. Use manual adjustments for groups, events and price changes.
- Single-user license. Do not redistribute.
FAQ
Where do I get the booking snapshots?
From a daily on-the-books report saved every morning, or rebuilt from the reservation history in your PMS (booking and cancellation dates per reservation).
How much history do I need?
At least 12 weeks; 52 weeks gives steady averages for every day of week. The History tab holds up to 56 weeks.
Should I use the additive or the multiplicative method?
Start at 50/50. The Accuracy tab shows the MAPE of each method by horizon on held-out weeks; move the weight toward the method with the lower error.
Does it handle sold-out nights and group blocks?
The forecast is capped at capacity and demand above capacity is reported separately. Group blocks are best entered as a manual adjustment; the guide explains how.
Does it need macros or add-ins?
No. Every result, including the what-if grids and the backtest, is a standard worksheet formula.