Energy Baseline Regression & Savings Verification Model: energy baseline regression and savings verification in Excel
Full description
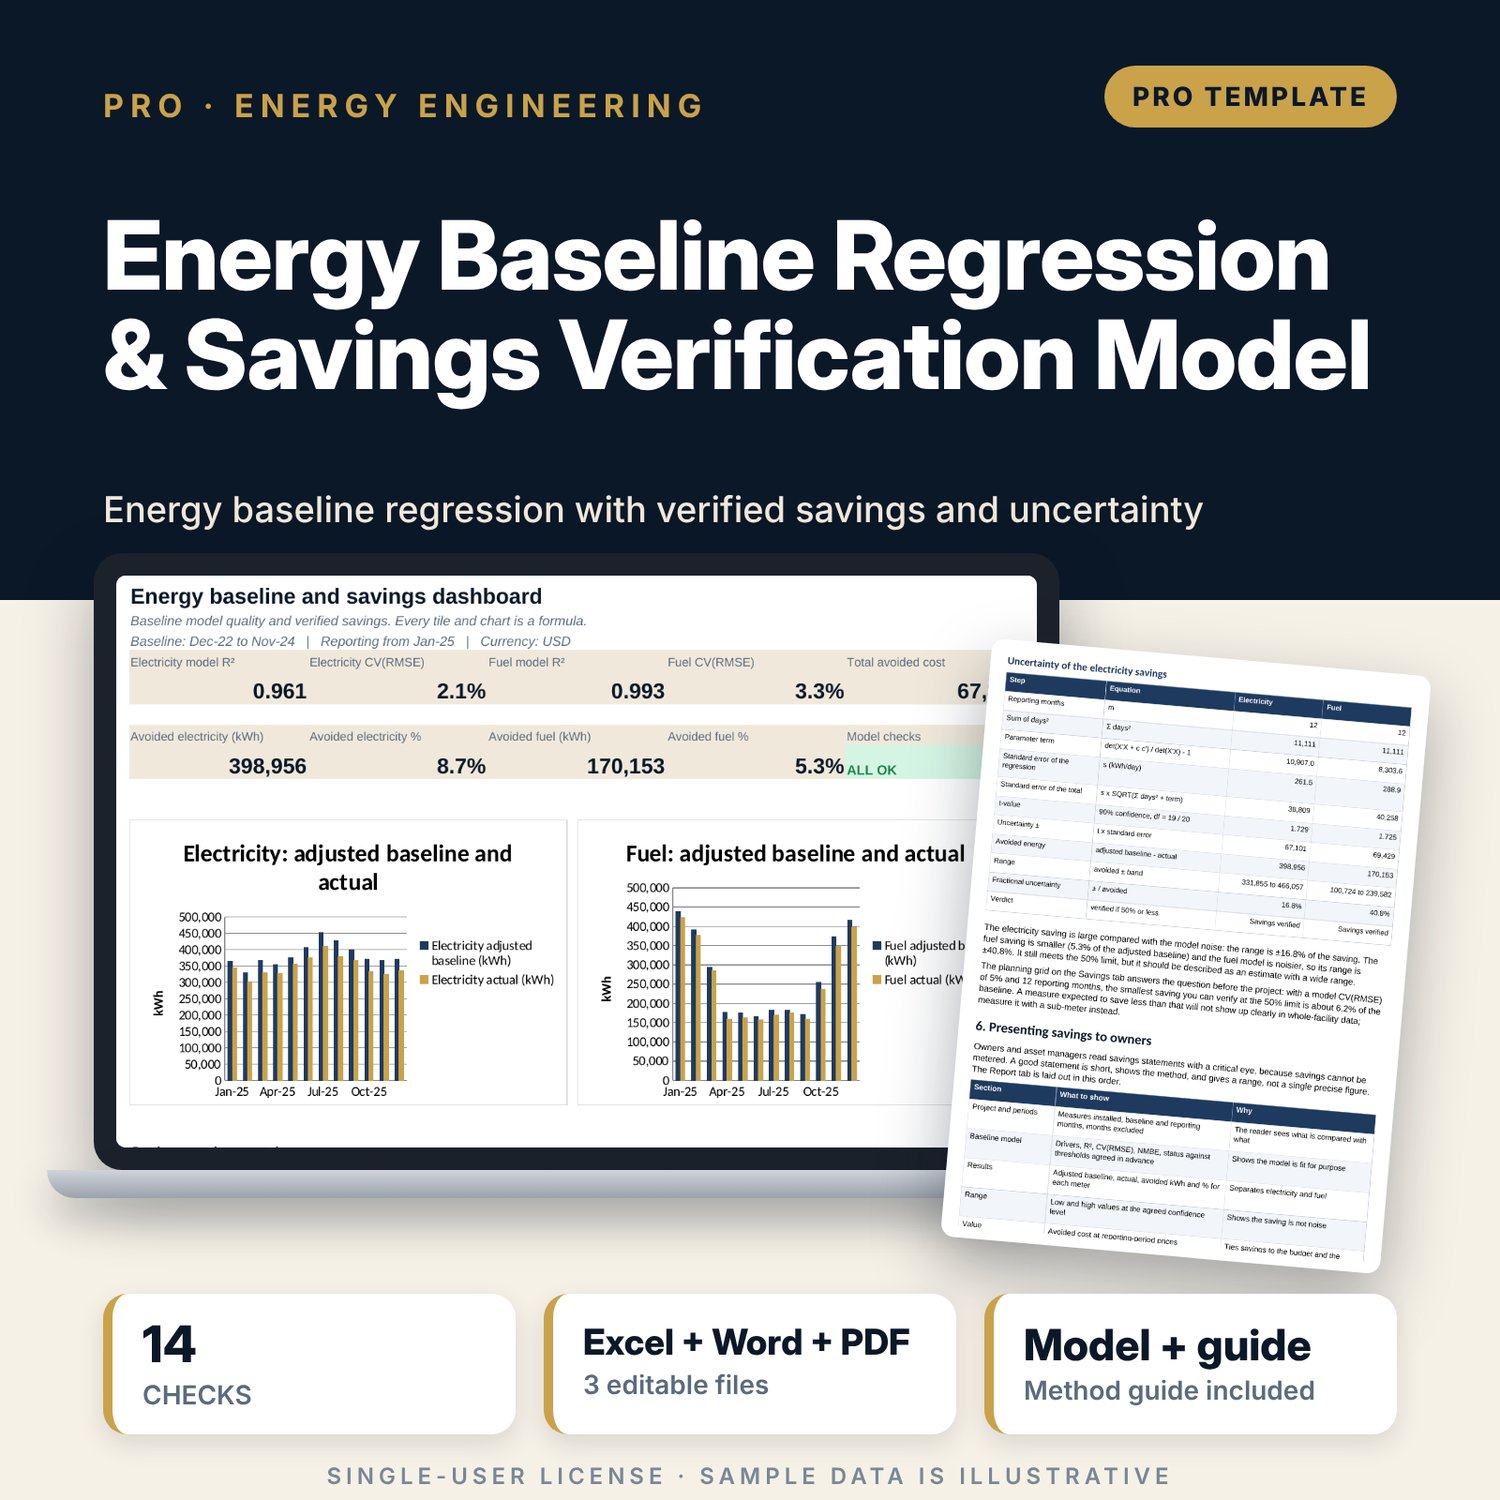
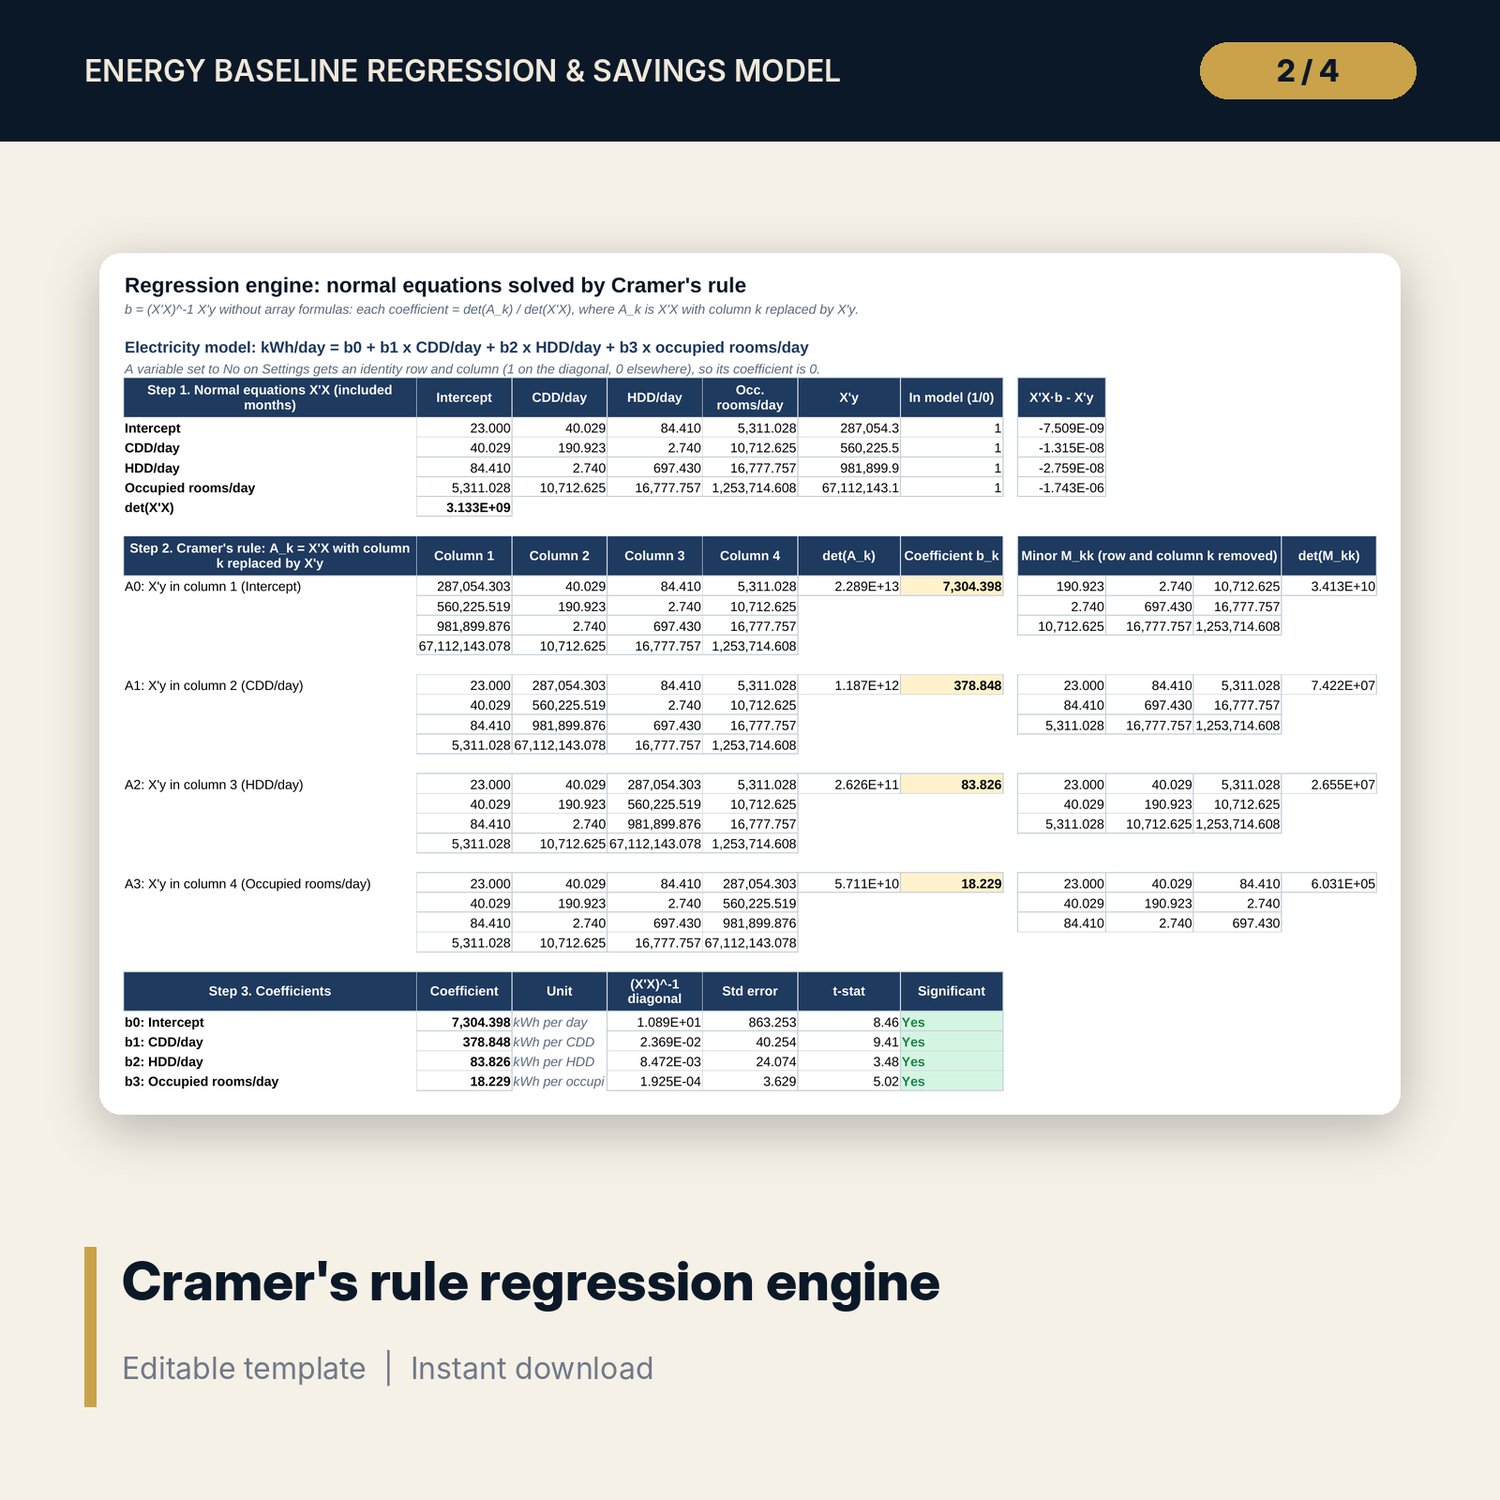
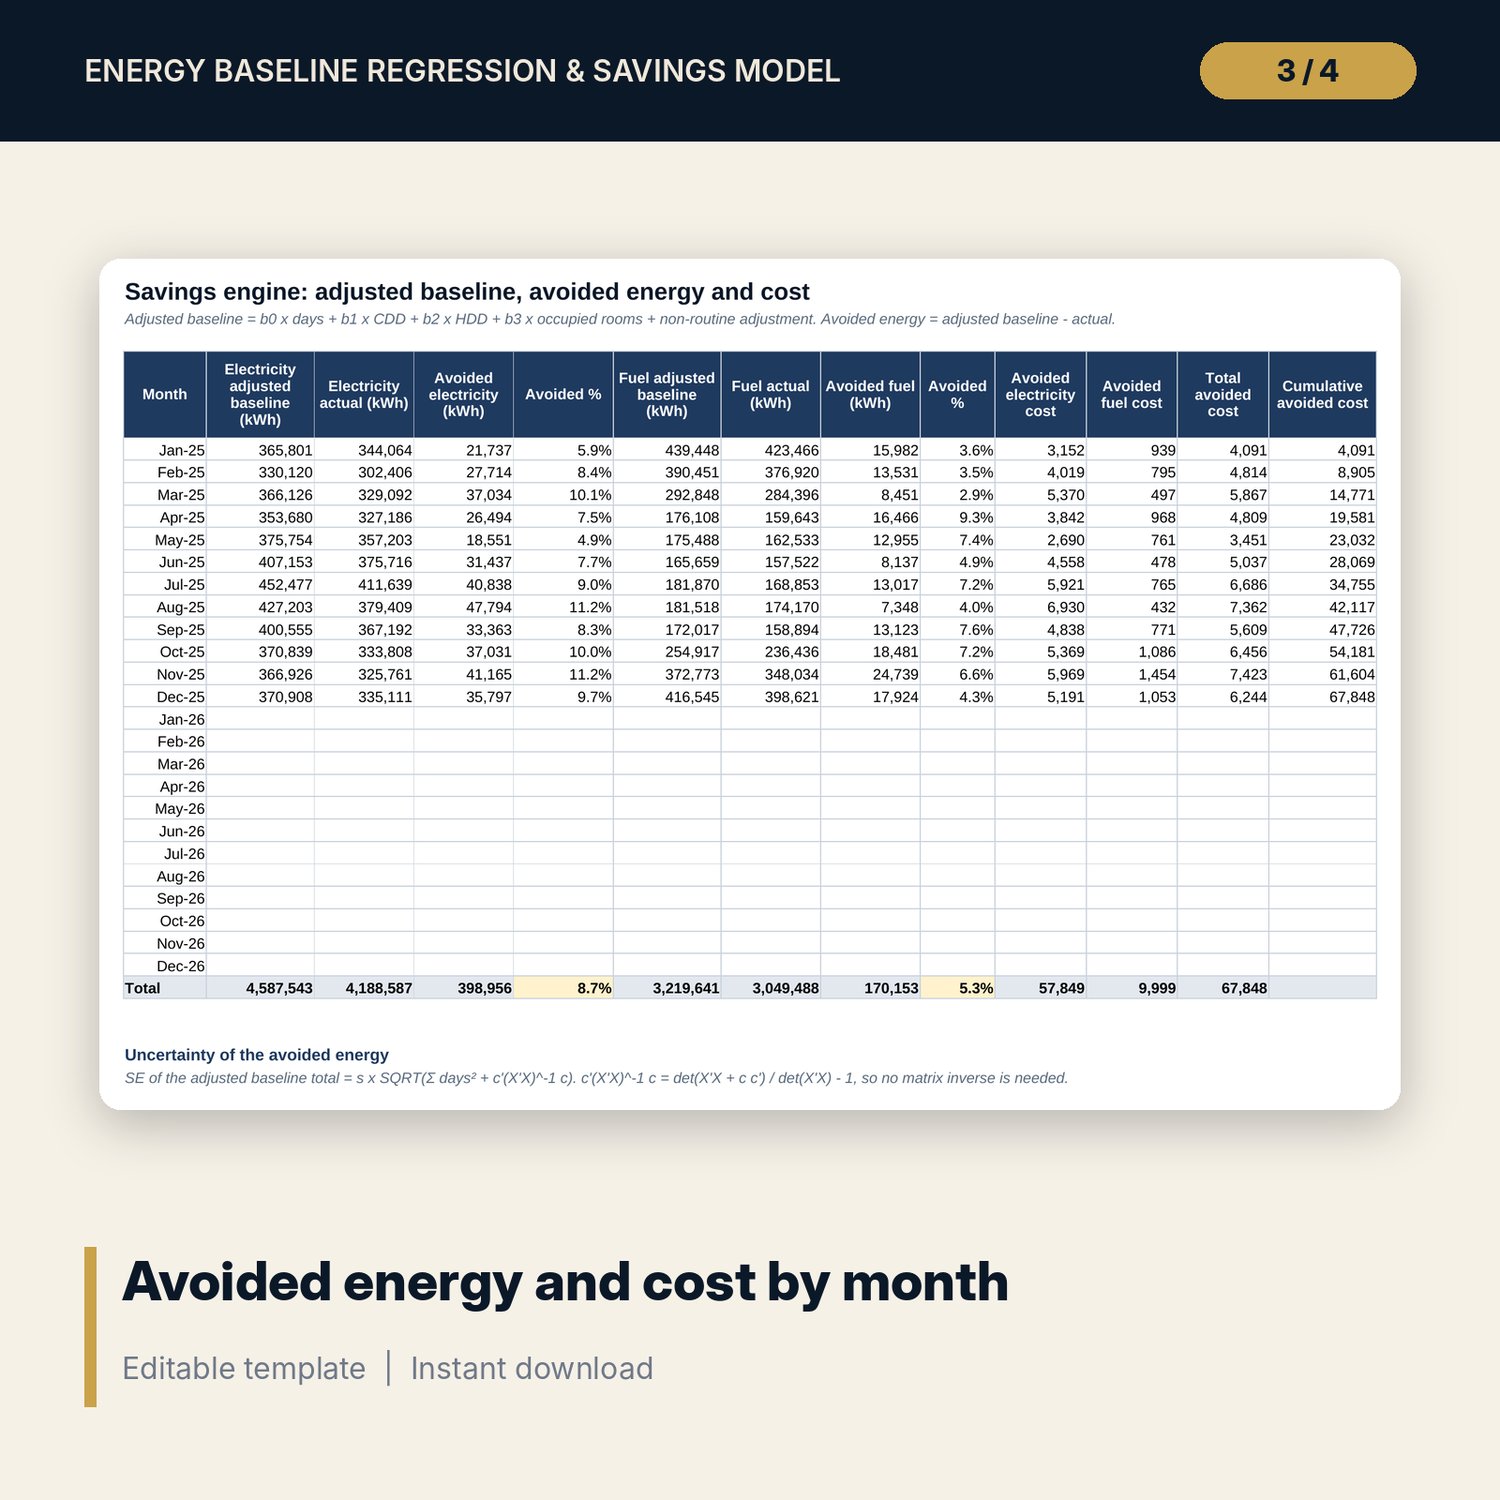
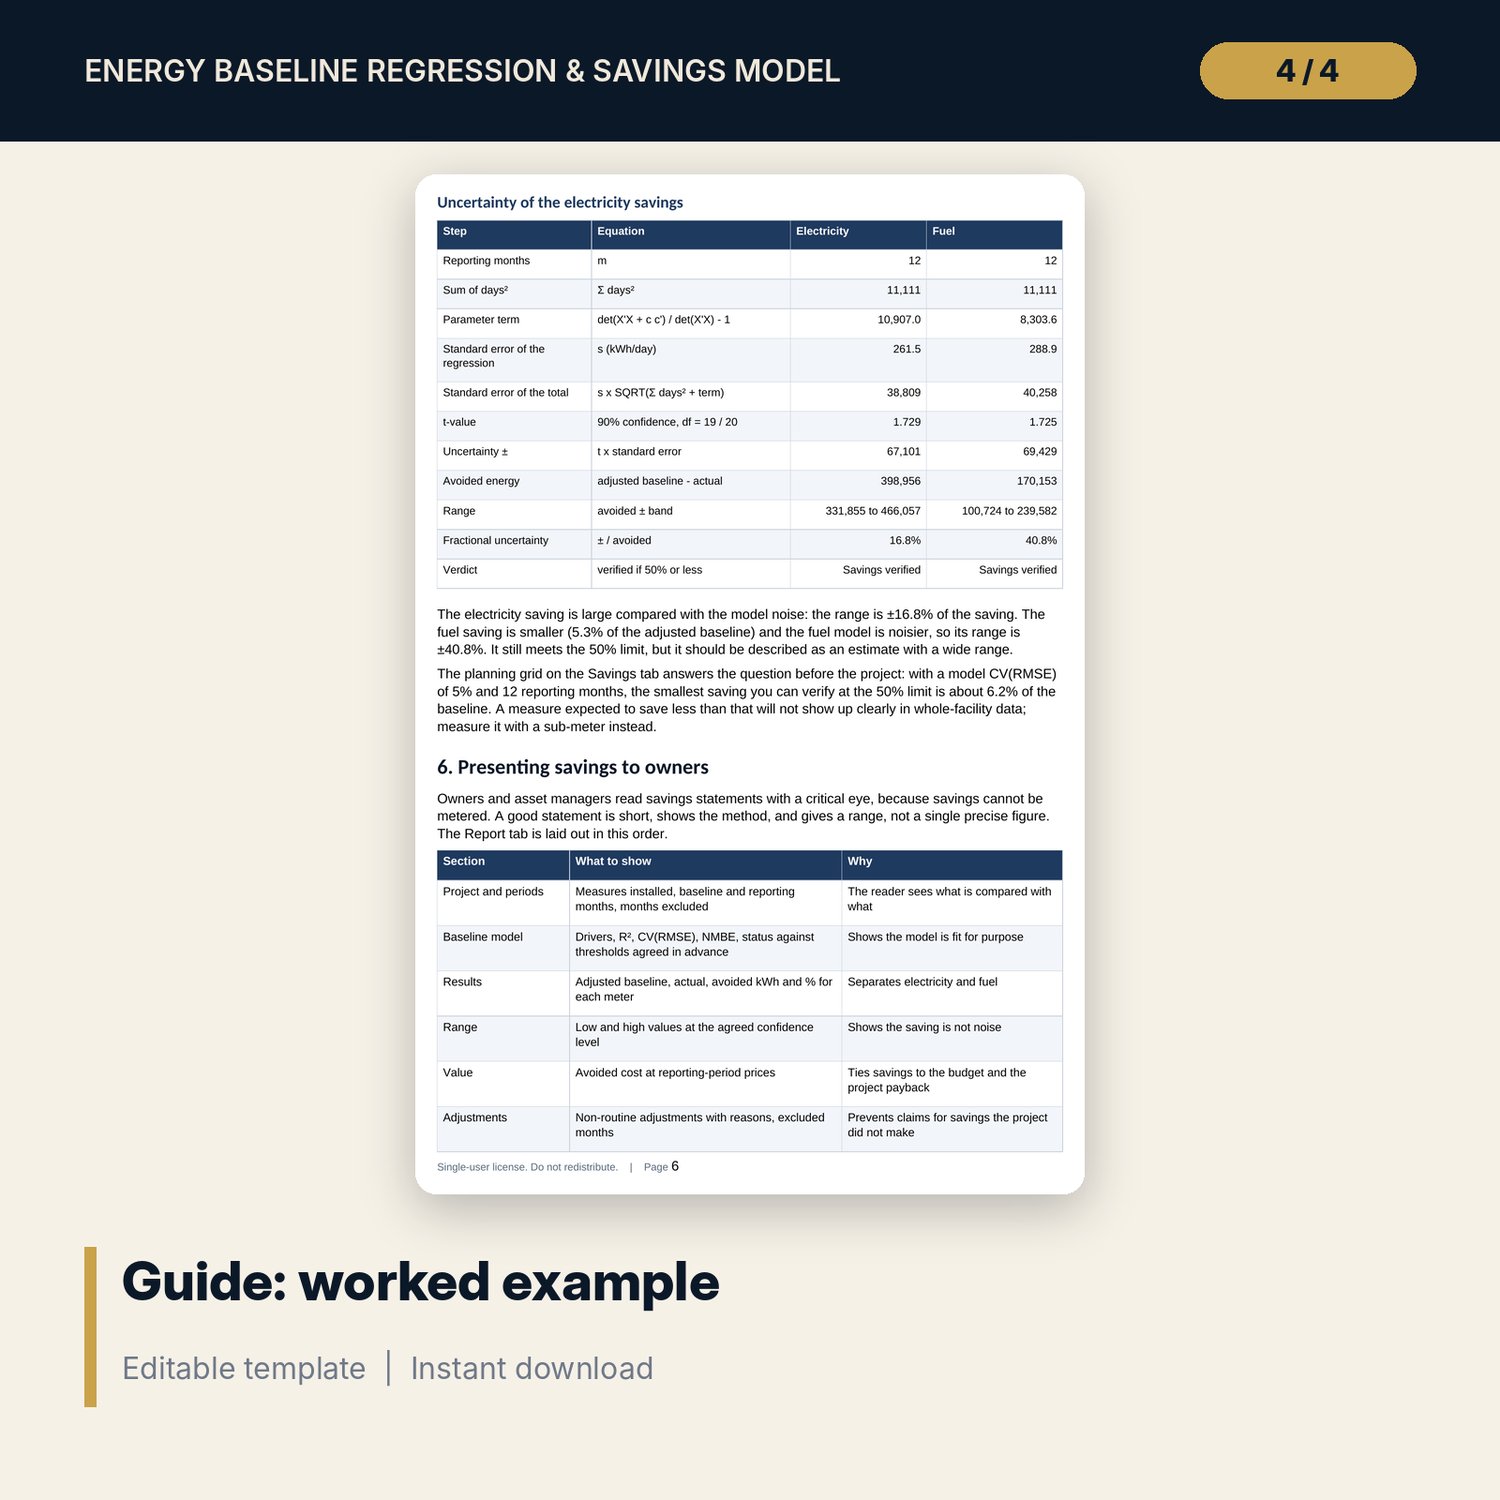
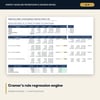
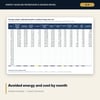
For chief engineers, energy managers, general managers and asset managers who must prove what an energy project saved. The workbook fits a whole-facility baseline for electricity and fuel on 24 months of data, with cooling degree days, heating degree days and occupied rooms as drivers. Degree days come from daily mean temperatures and base temperatures you set. The regression runs on per-day values: normal equations are built with SUMPRODUCT and solved by Cramer's rule with MDETERM, so every step is visible and there are no array formulas. You get coefficients with standard errors and t-stats, R², adjusted R², CV(RMSE) and NMBE against acceptance thresholds, and a single-variable SLOPE model for comparison. After the project, the model gives the adjusted baseline for each reporting month, including non-routine adjustments, then the avoided energy and cost and a ± range at the confidence level you choose. A one-page statement and a 10-page guide help you present the result to owners.
Save with a bundle: this workbook is also in the Hotel Engineering & MEP Pro Bundle, 25 workbooks for $59 instead of $319. All 100 Pro workbooks are in the Pro Library for $119, and all 241 templates and workbooks are in the Ultimate Hospitality Library for $149.
What is inside
- Energy_Baseline_Regression_Savings_Model.xlsx: 12 tabs, 4,928 formulas, 6 native charts, 14 integrity checks, 19-row Method tab
- Weather: 1,500 daily rows (1,127 sample days) with CDD and HDD per day
- Baseline_Data: 24 sample months with include flag and reason; Reporting_Data: 24 rows (12 sample months) with non-routine adjustments and a range check
- Regression engine for 2 meters: 4 x 4 normal equations, 4 Cramer matrices and 4 minors each, coefficients with t-stats, 13 fit statistics, single-variable comparison
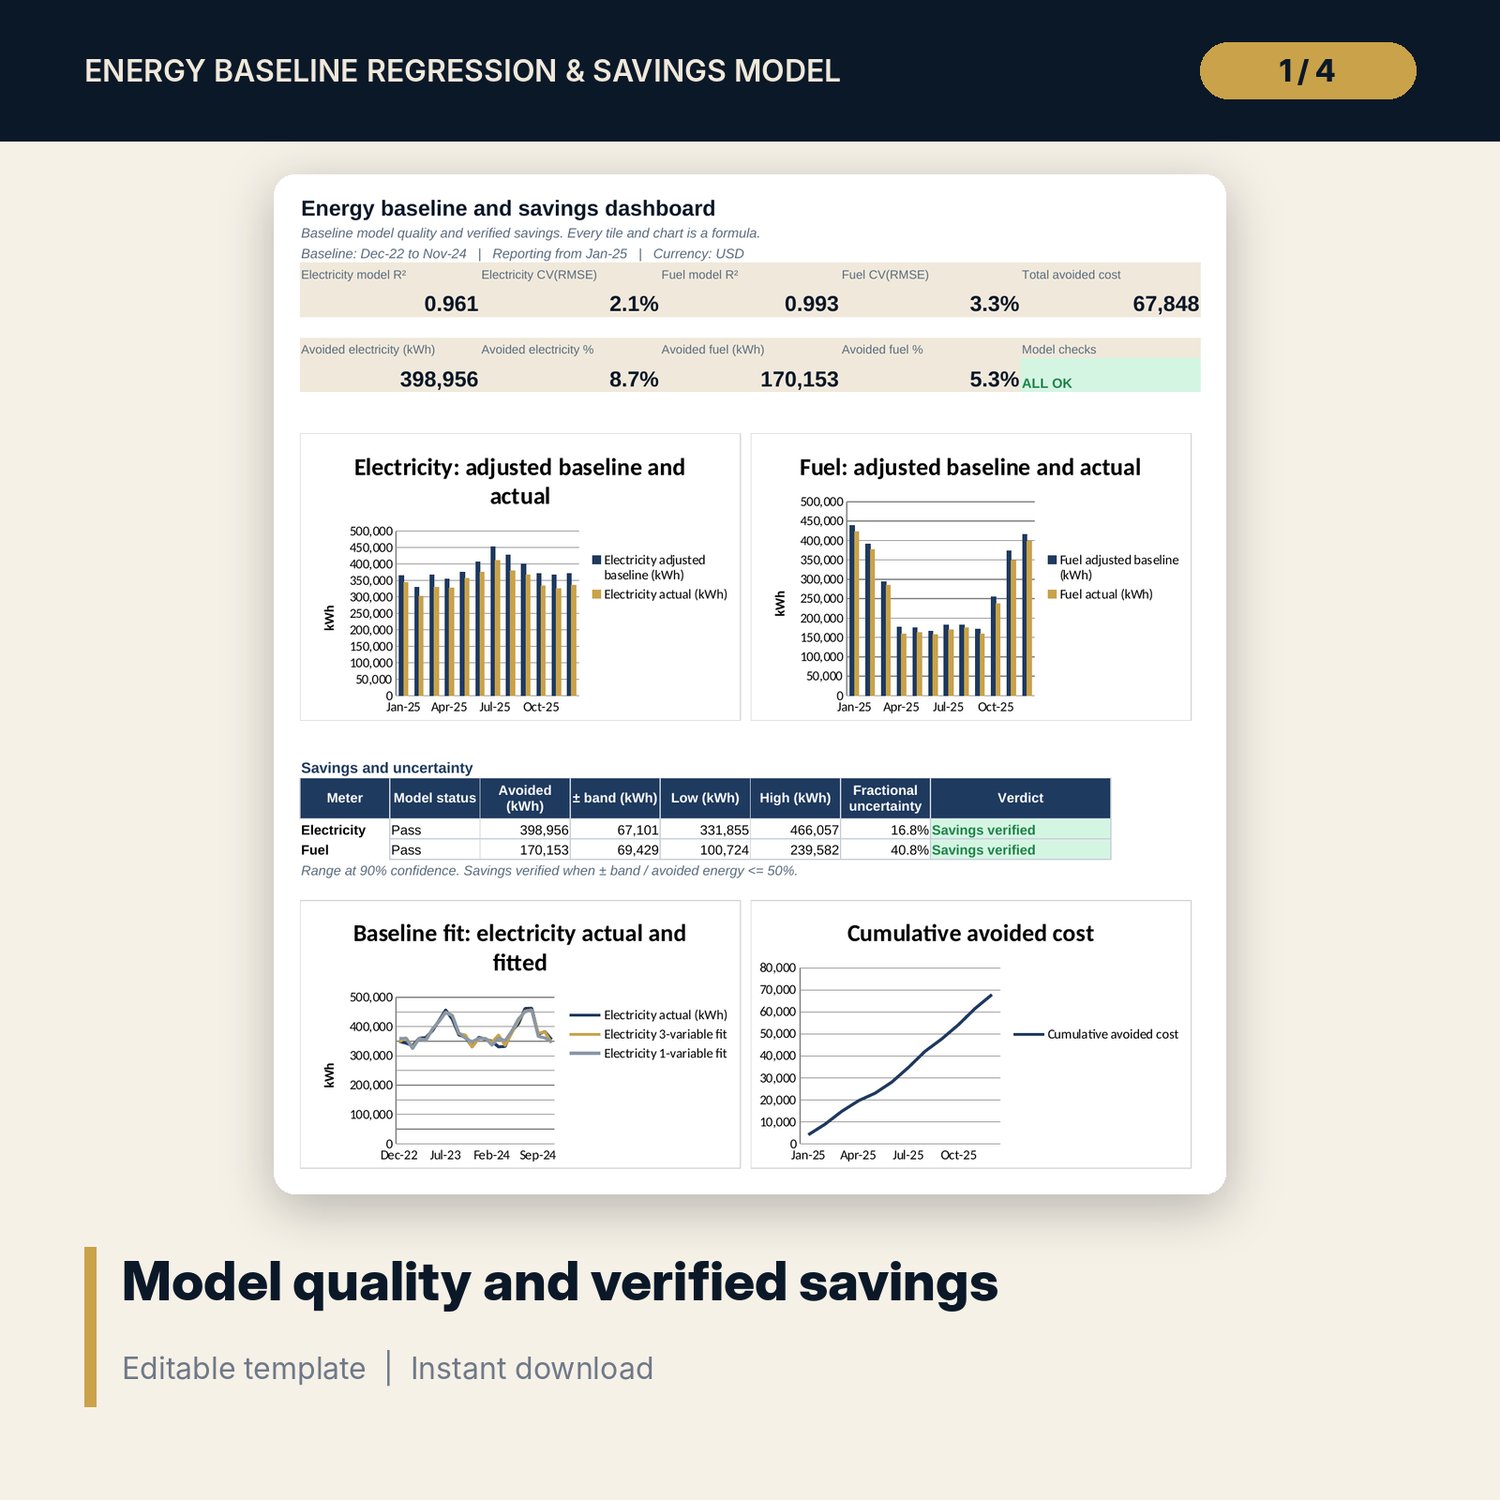
- Savings: adjusted baseline, avoided energy and cost by month, uncertainty block, 2 sensitivity grids (6 x 6)
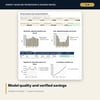
- Dashboard (9 KPI tiles, check status, 4 charts) and a one-page savings statement with sign-off
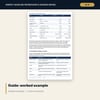
- Energy_Baseline_Savings_Verification_Guide.docx and Energy_Baseline_Savings_Verification_Guide.pdf: 10-page guide on degree days, baseline rules, the equations, a worked example and presenting savings to owners
- README.txt and LICENSE-and-Terms.txt
How it works
- Set the periods, prices, fuel conversion factor, base temperatures and model variables on Settings.
- Paste daily temperatures and enter 24 baseline months; exclude months with non-routine events and give the reason.
- Accept the model when R², CV(RMSE) and NMBE pass and every driver is significant or switched off.
- Enter reporting months after the project, with non-routine adjustments where needed.
- Read avoided energy, avoided cost and the confidence range on Savings, Dashboard and the Report tab.
Details
- Formats: XLSX workbook, DOCX guide, PDF guide
- Language: English
- Units: kWh, °C, K·day, occupied rooms; fuel converted to kWh with your bill factor
- Software: Excel 2016 or later (Windows or Mac) or LibreOffice Calc; Word or any DOCX editor for the guide
- No macros, no array formulas, no external links
- Delivery: instant download
Good to know
- Sample data is illustrative. Replace it with your own data.
- Not engineering, legal or financial advice. Agree the method, thresholds and confidence level with the owner before the project.
- Prices, conversion factors, base temperatures and acceptance thresholds are editable inputs. Verify local requirements and contract terms.
- The range covers model error only; it does not include meter error.
- Single-user license.
FAQ
Do I need statistics software?
No. The regression is solved inside the workbook with SUMPRODUCT and MDETERM. Every intermediate matrix is visible.
Can I drop a driver, for example HDD in a hot climate?
Yes. Set it to No on Settings. The workbook keeps the matrix solvable and the coefficient becomes zero.
What if I only have 12 months of baseline data?
The model runs with 12 or more included months, as long as every season is covered. The range will be wider; the planning grid shows how much.
Where do I get degree days?
Paste daily mean temperatures from a nearby weather station or a weather data service, or type monthly degree days over the formulas.
Can I report more than one year?
Yes. Reporting_Data holds 24 months, and the statement covers every month with data.