

Electricity Tariff & Demand Charge Analyzer: time-of-use and demand charge analysis in Excel
Full description
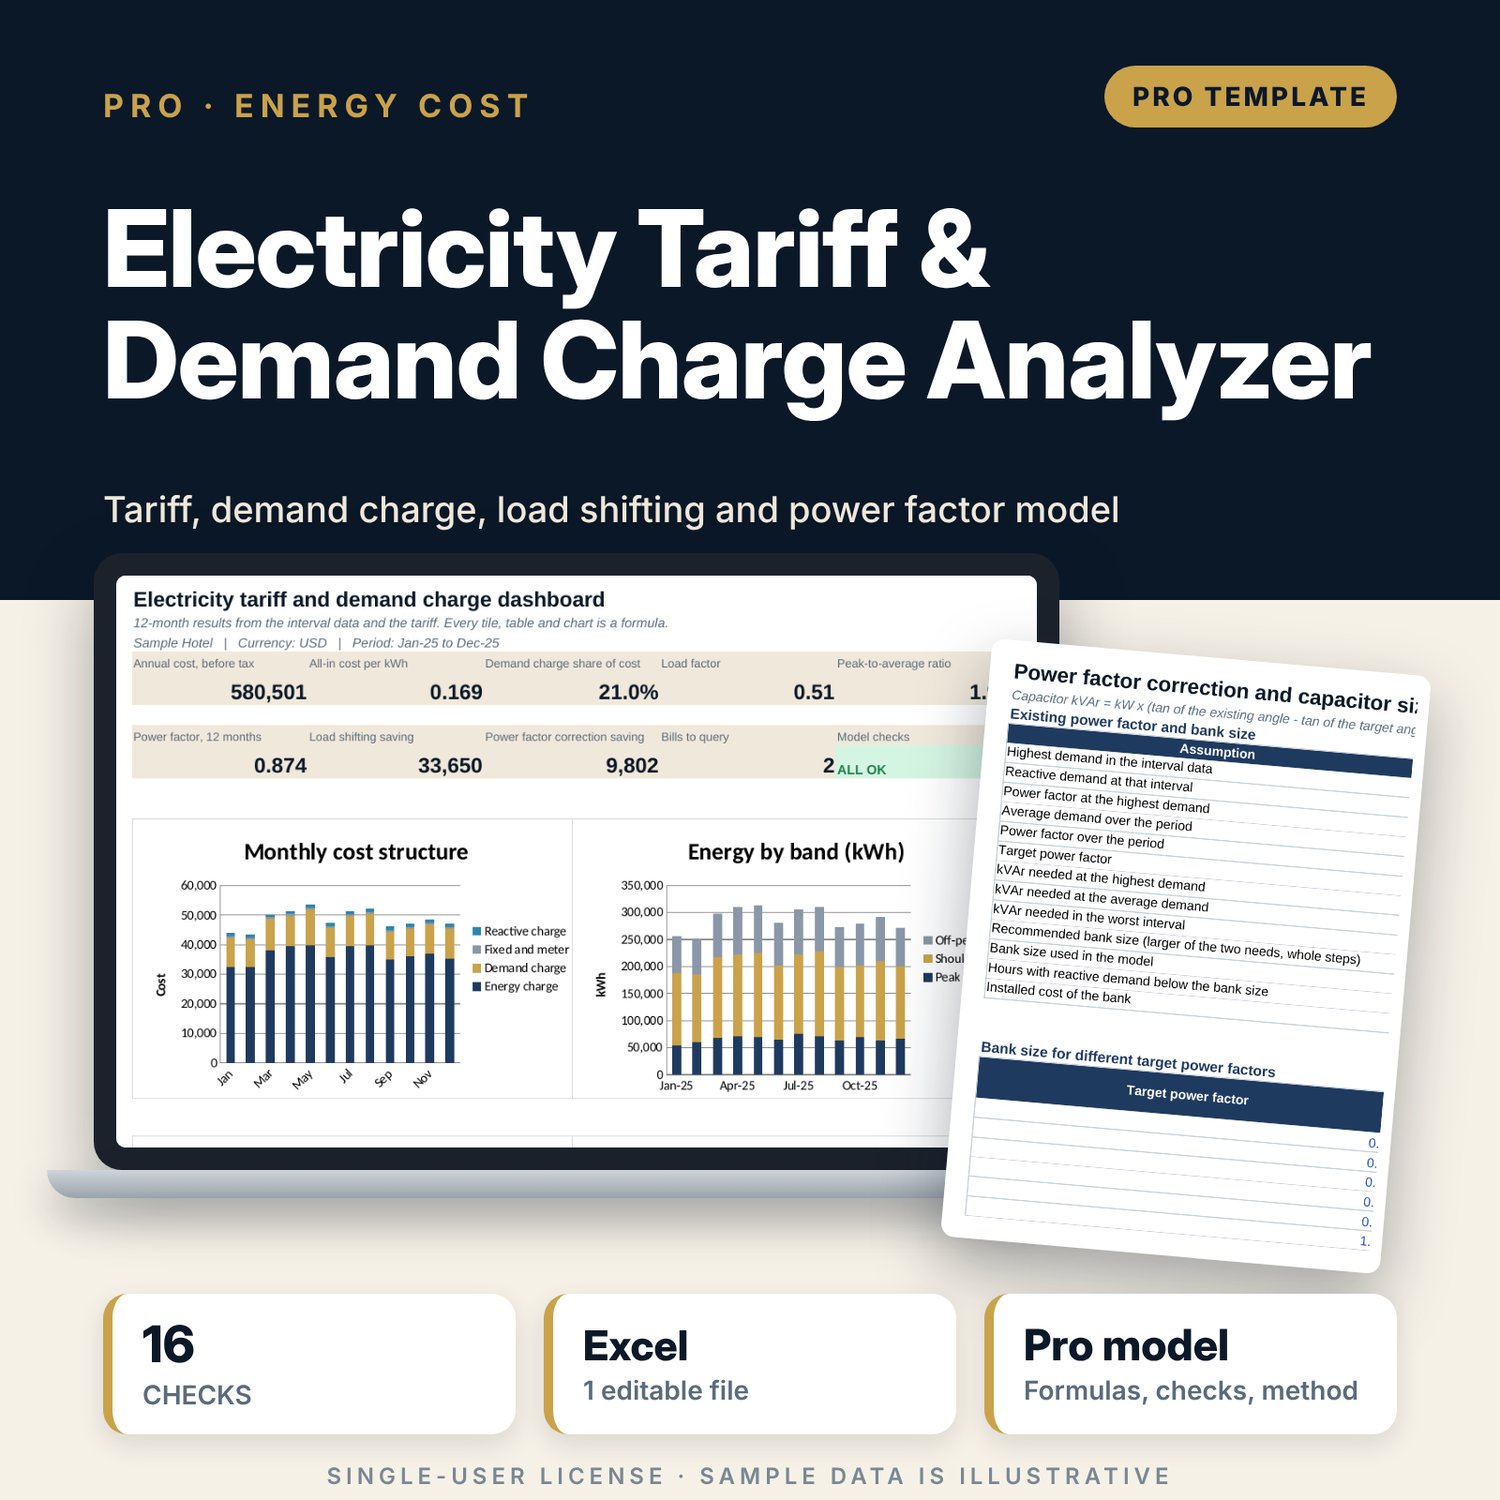
For chief engineers, energy managers, finance controllers and general managers who pay an electricity bill with time-of-use energy rates, a maximum demand charge and a power factor clause. The workbook classifies 8,760 hours of kW and kVAr data into peak, shoulder and off-peak bands and builds each month: energy by band, maximum and billing demand, load factor, peak-to-average ratio, power factor, and the energy, demand, fixed and reactive charges. It shows the true cost per kWh of each band and the cost of each kW at the peak, checks your invoices against the model, tests load shifting (chiller pre-cooling and laundry timing) interval by interval, and sizes a capacitor bank from kW and the power factor you want.
Save with a bundle: this workbook is also in the Hotel Engineering & MEP Pro Bundle, 25 workbooks for $59 instead of $319. All 100 Pro workbooks are in the Pro Library for $119, and all 241 templates and workbooks are in the Ultimate Hospitality Library for $149.
What is inside
- Electricity_Tariff_Demand_Charge_Analyzer.xlsx: 12 tabs, 80,274 formulas, 7 native charts, 16 integrity checks, 19-row Method tab
- Interval_Data: 8,784 hourly rows (8,760 sample hours of kW and kVAr) with band, day type and load shifting columns
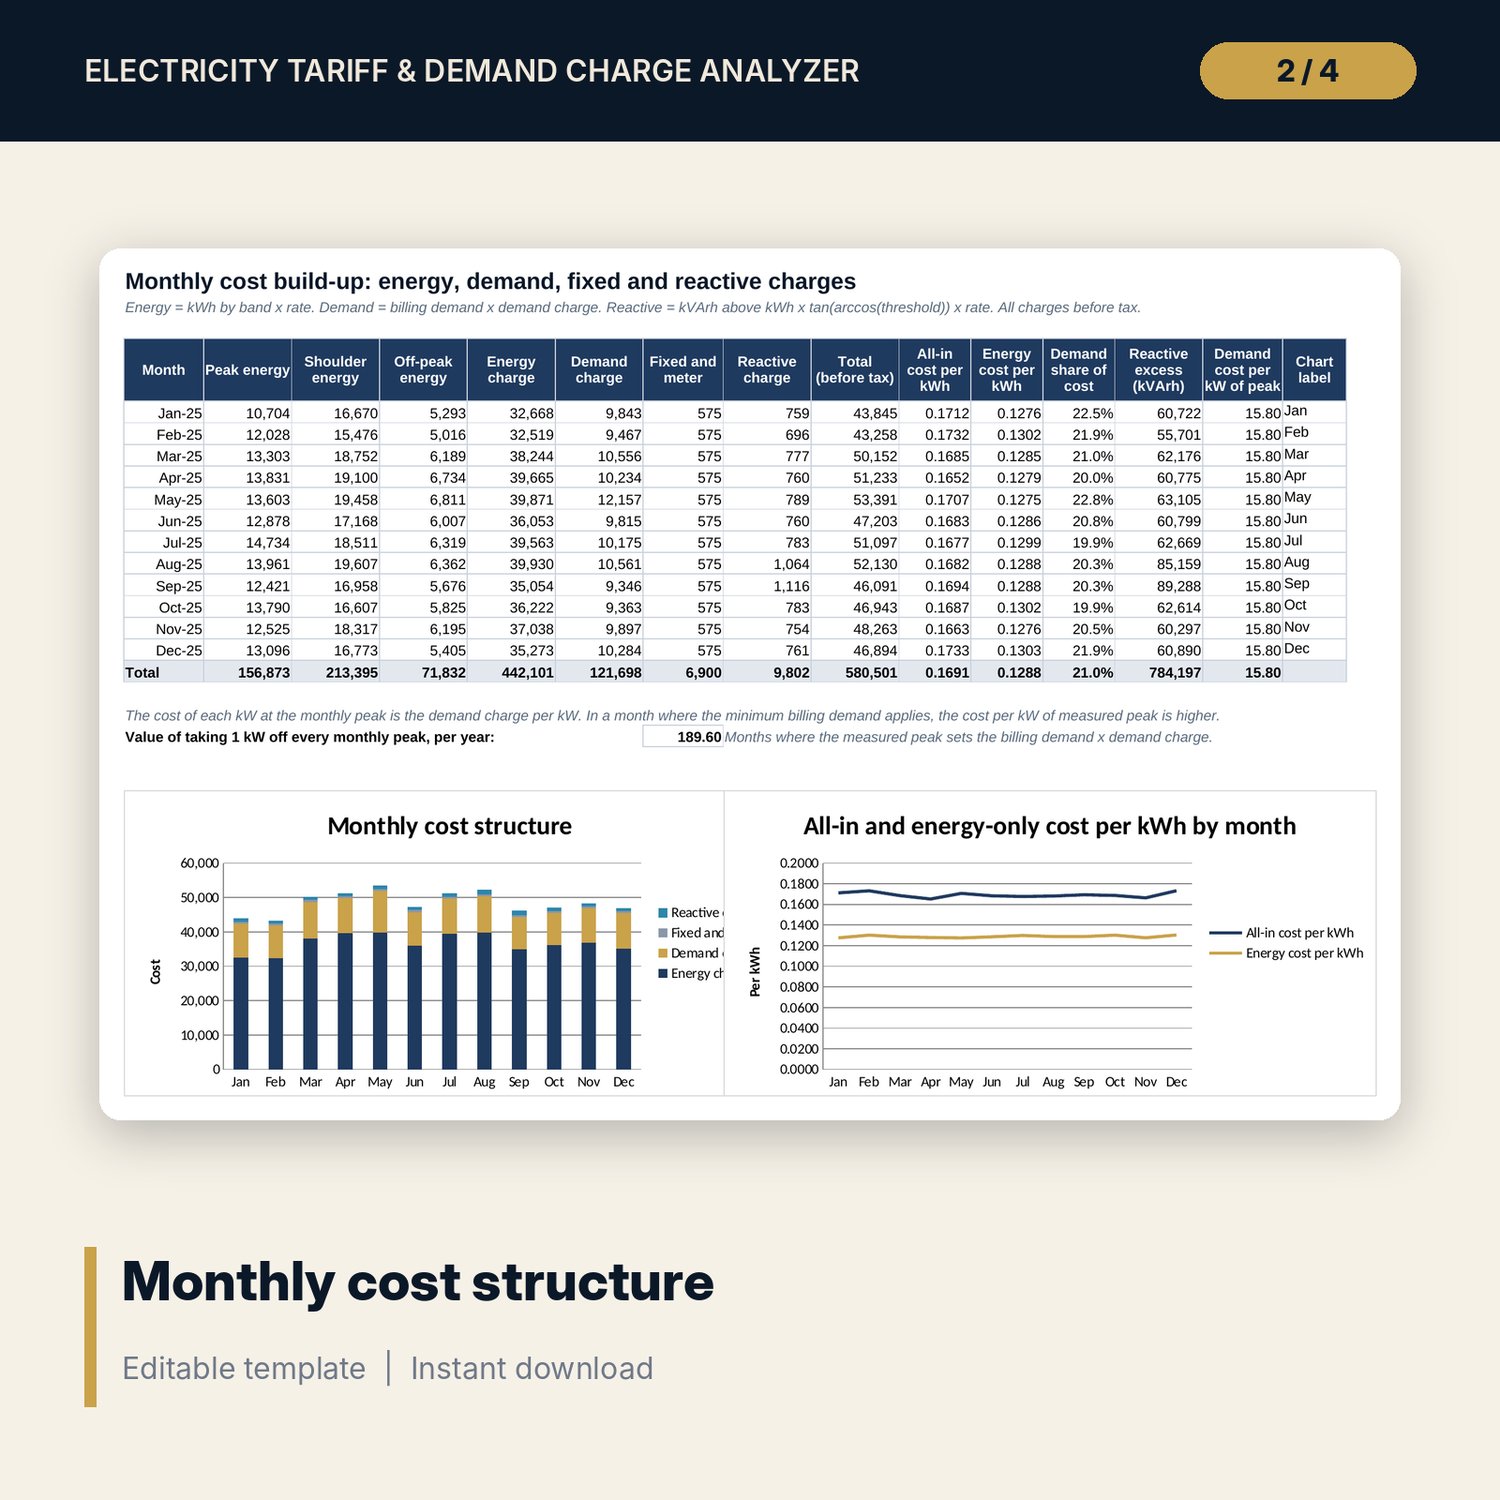
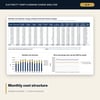
- Monthly_Usage (19 columns) and Monthly_Cost (15 columns): kWh by band, billing demand, load factor, power factor, and every charge by month, with 2 charts
- Bill_Check: 12 invoice rows against the model with kWh, demand, kVArh and amount differences and a Query flag
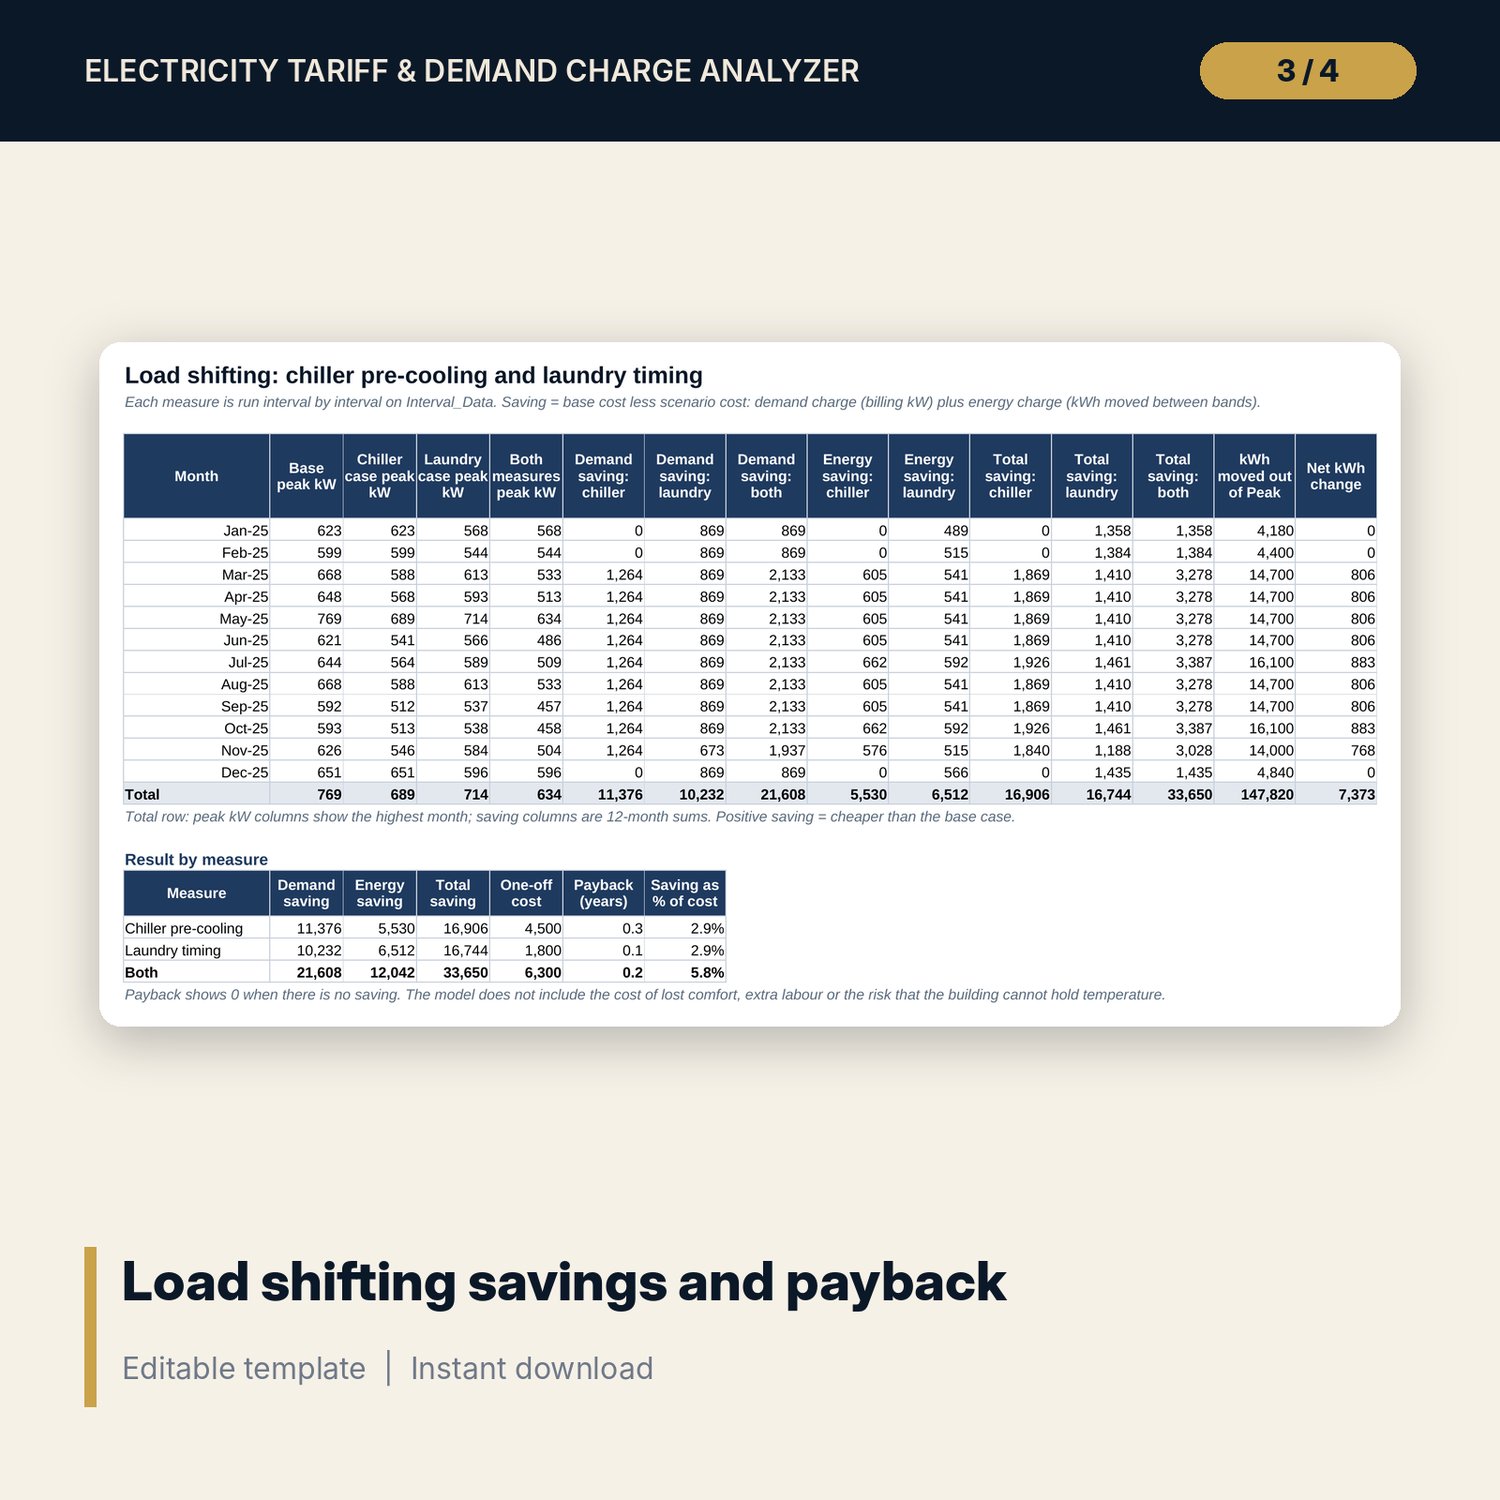
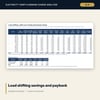
- Load_Shift: chiller pre-cooling and laundry timing, demand and energy saving by month, payback and a kW grid
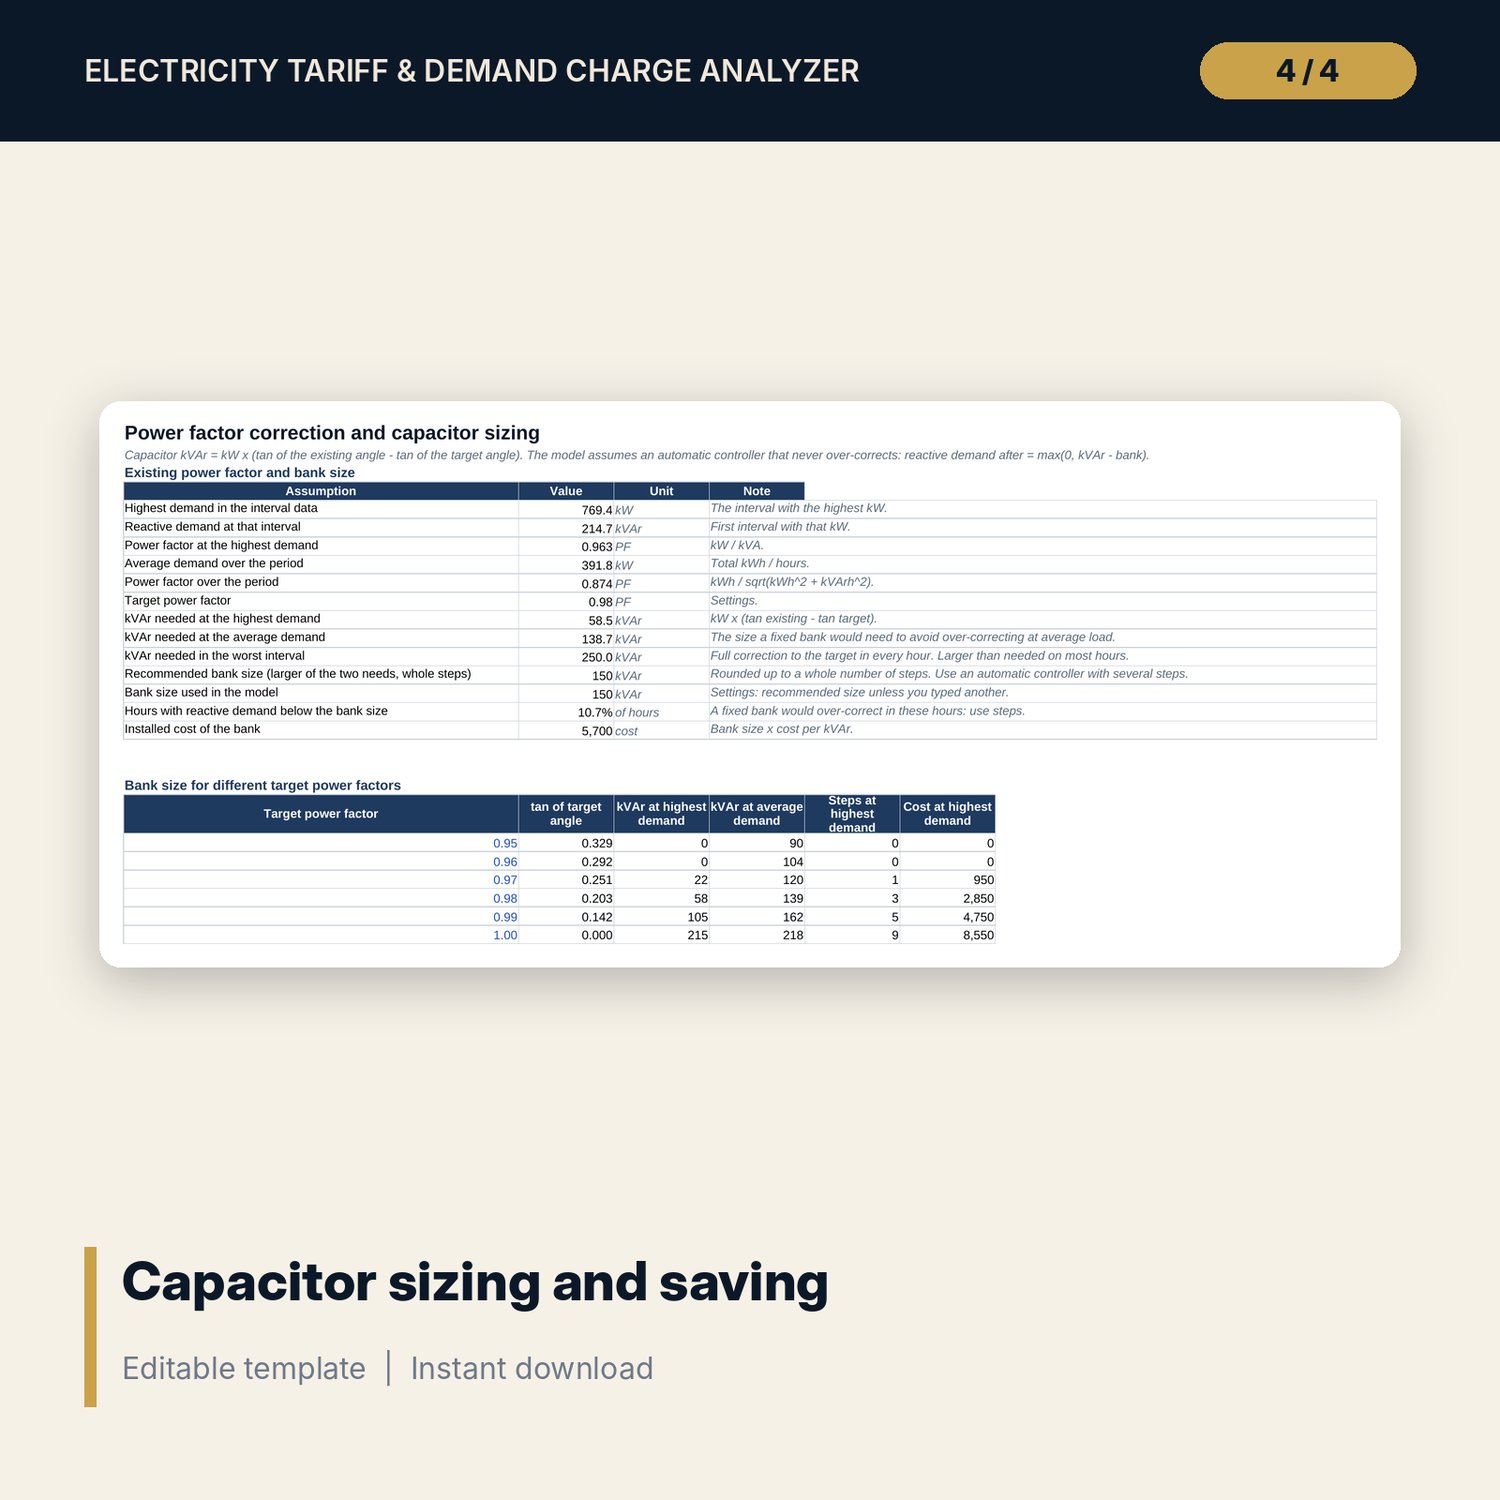
- Load_Profile: average load by hour of day before and after shifting; PF_Correction: bank size for 6 target power factors and the reactive charge before and after
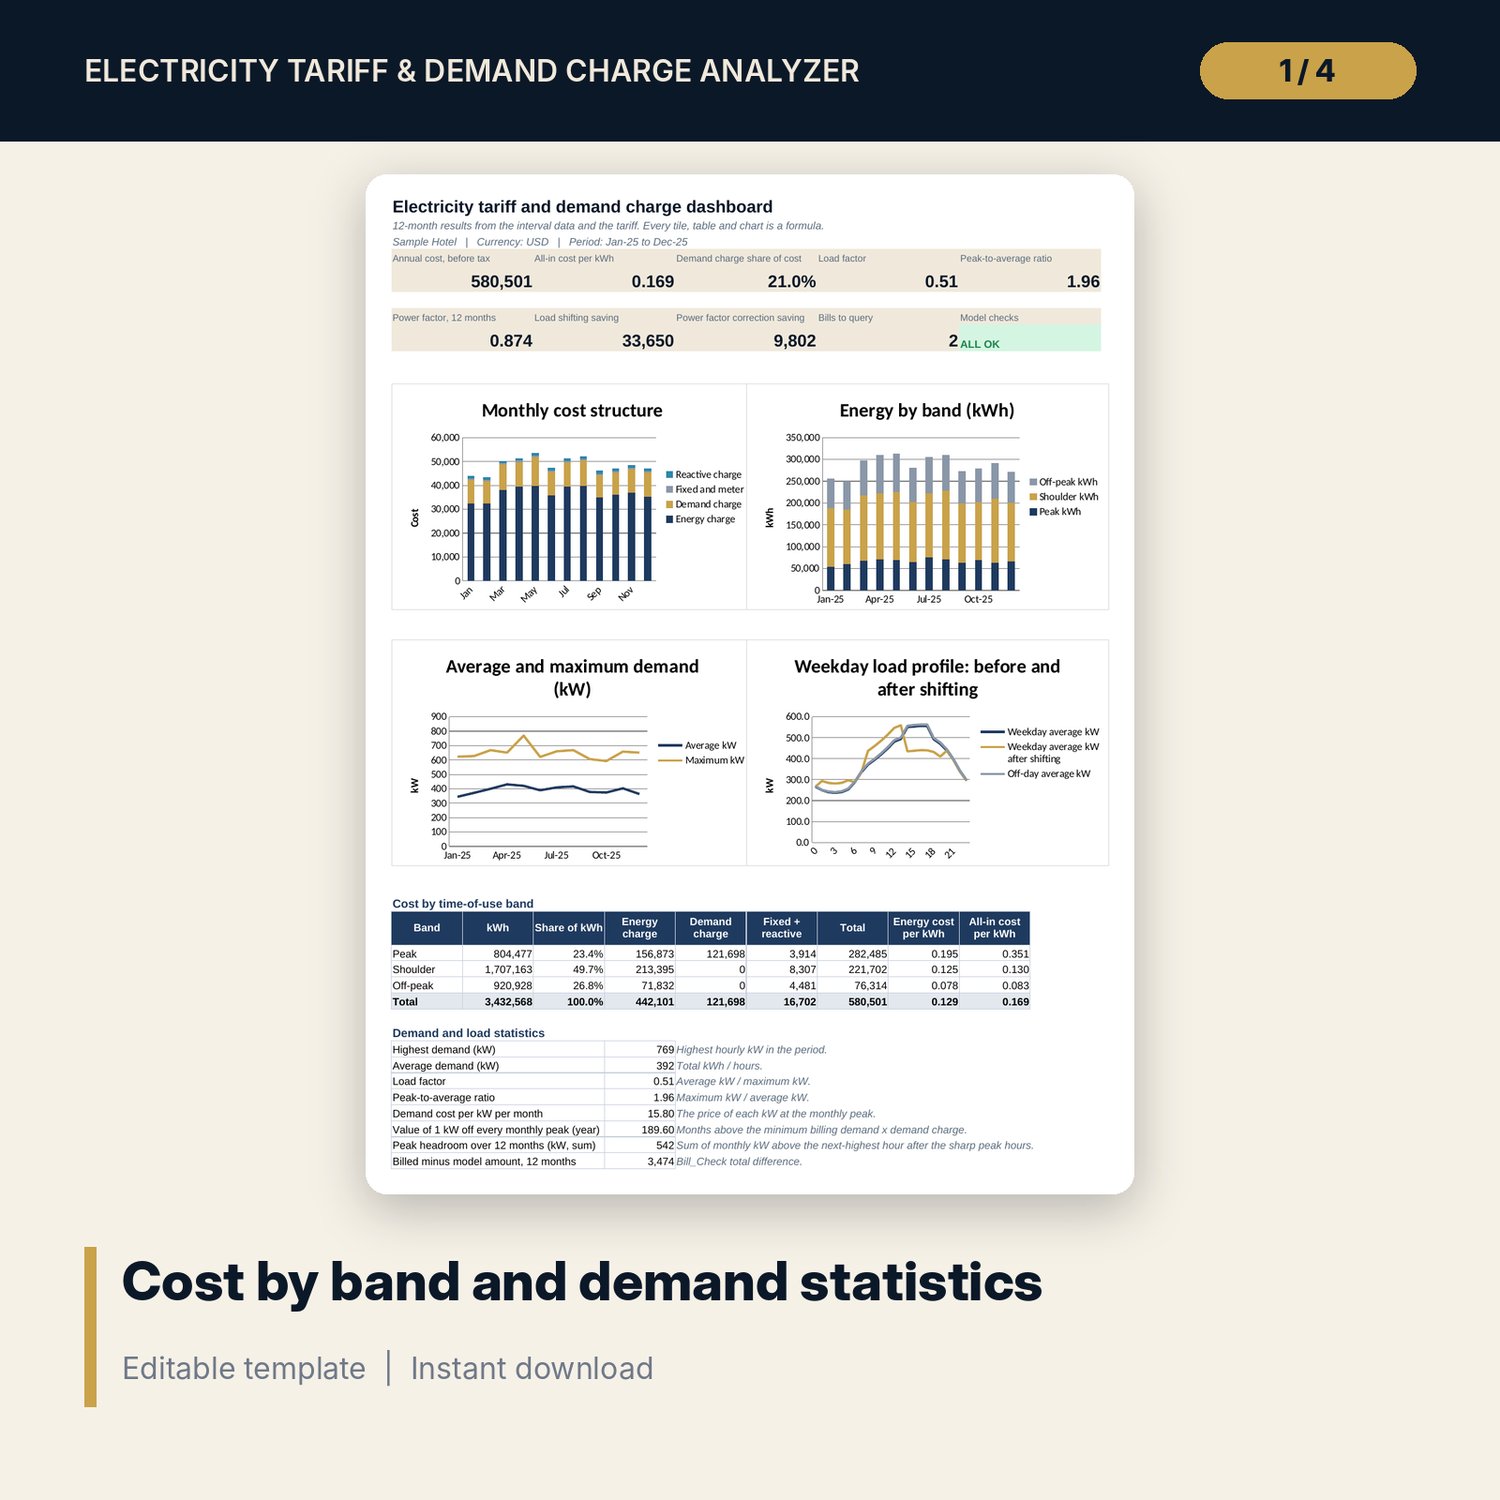
- Dashboard: 9 KPI tiles, the check status, 4 charts, cost by band and demand statistics
- README.txt and LICENSE-and-Terms.txt
How it works
- Enter your energy rates, demand charge, fixed charges, power factor clause and the hour-to-band table on Settings.
- Paste 12 months of hourly kW and kVAr into Interval_Data, then enter each invoice on Bill_Check.
- Read Monthly_Cost and the Dashboard: cost by band, demand share, load factor and the cost of each kW at the peak.
- Set your chiller and laundry shift inputs and read the saving and payback on Load_Shift.
- Read PF_Correction for the capacitor size and the reactive charge saving, then confirm Checks shows ALL OK.
Details
- Formats: one XLSX workbook
- Language: English
- Units: kW, kVAr, kWh, kVArh, hour of day 0 to 23; costs before tax in your currency
- Software: Excel 2016 or later (Windows or Mac) or LibreOffice Calc
- No macros, no array formulas, no external links
- Delivery: instant download
Good to know
- Sample data and tariff values are illustrative. Replace them with your own data and your own tariff schedule.
- Not engineering, tax or financial advice. Verify every rate, rule, window and capacitor size with your supplier and your adviser before you act.
- Demand is the hourly average kW. If your tariff bills on a 15-minute or 30-minute maximum, the model understates the peak.
- One meter or one site per copy. One flat set of rates for the 12 months: seasonal rates need a second copy.
- Single-user license.
FAQ
Can I use 15-minute meter data?
Aggregate it to hourly averages first (kW) and paste that. Set the interval length to 1 hour. The model then matches an hourly tariff window.
Which tariff structures does it cover?
Three time-of-use bands with separate weekday and off-day hours, a demand charge on the monthly maximum kW in the bands you mark, a minimum billing demand, fixed and meter charges, and a reactive energy charge above a power factor threshold.
How does the bill check work?
It recalculates each month from your interval data and tariff and compares kWh, billing demand, kVArh and amount with your invoice. A difference above your tolerance reads Query.
Is the load shifting saving a guarantee?
No. It is a test on your own data with inputs you set for the kW moved, the windows and the extra energy. Confirm the loads and the comfort impact with your plant team first.
How is the capacitor bank sized?
kVAr = kW x (tan of the existing angle minus tan of the target angle), at the highest demand and at the average demand. The larger need is rounded up to whole steps.